 2
2peptides
spectra
0.000 | 0.000
0.000 | 0.122
0.091 | 0.239
0.000 | 0.180
0.000 | 0.195
0.207 | 0.503
0.233 | 0.344
0.000 | 0.000
3peptides
spectra
0.000 | 0.000
1.000 | 1.000
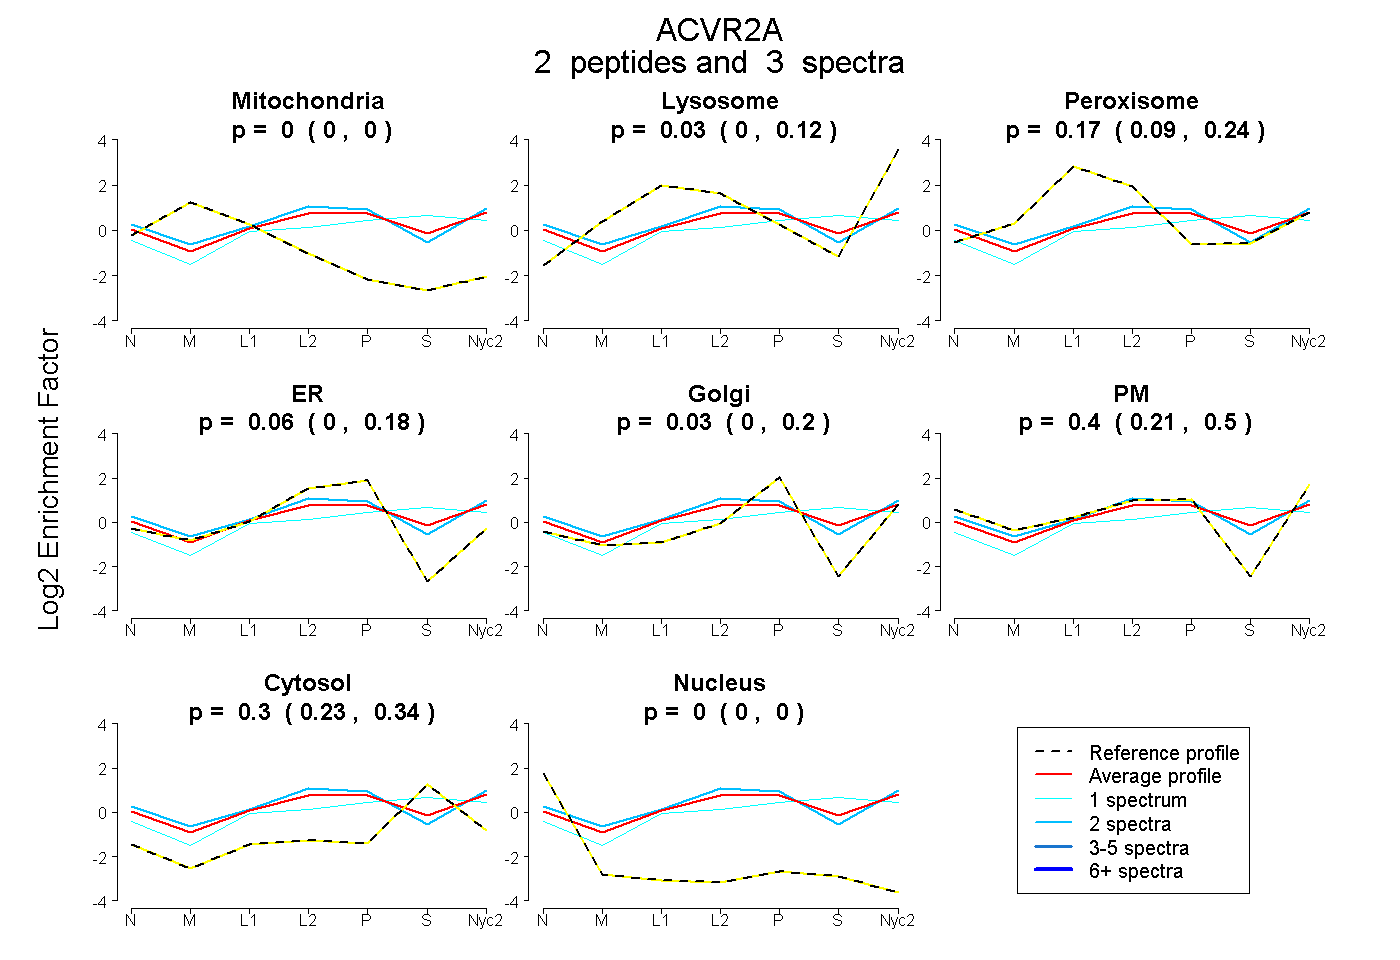
| Plot | Mito | Lyso | Perox | ER | Golgi | PM | Cytosol | Nucleus | |||||
| Expt A |
2 peptides |
3 spectra |
|
0.000 0.000 | 0.000 |
0.031 0.000 | 0.122 |
0.172 0.091 | 0.239 |
0.062 0.000 | 0.180 |
0.034 0.000 | 0.195 |
0.402 0.207 | 0.503 |
0.299 0.233 | 0.344 |
0.000 0.000 | 0.000 |
||
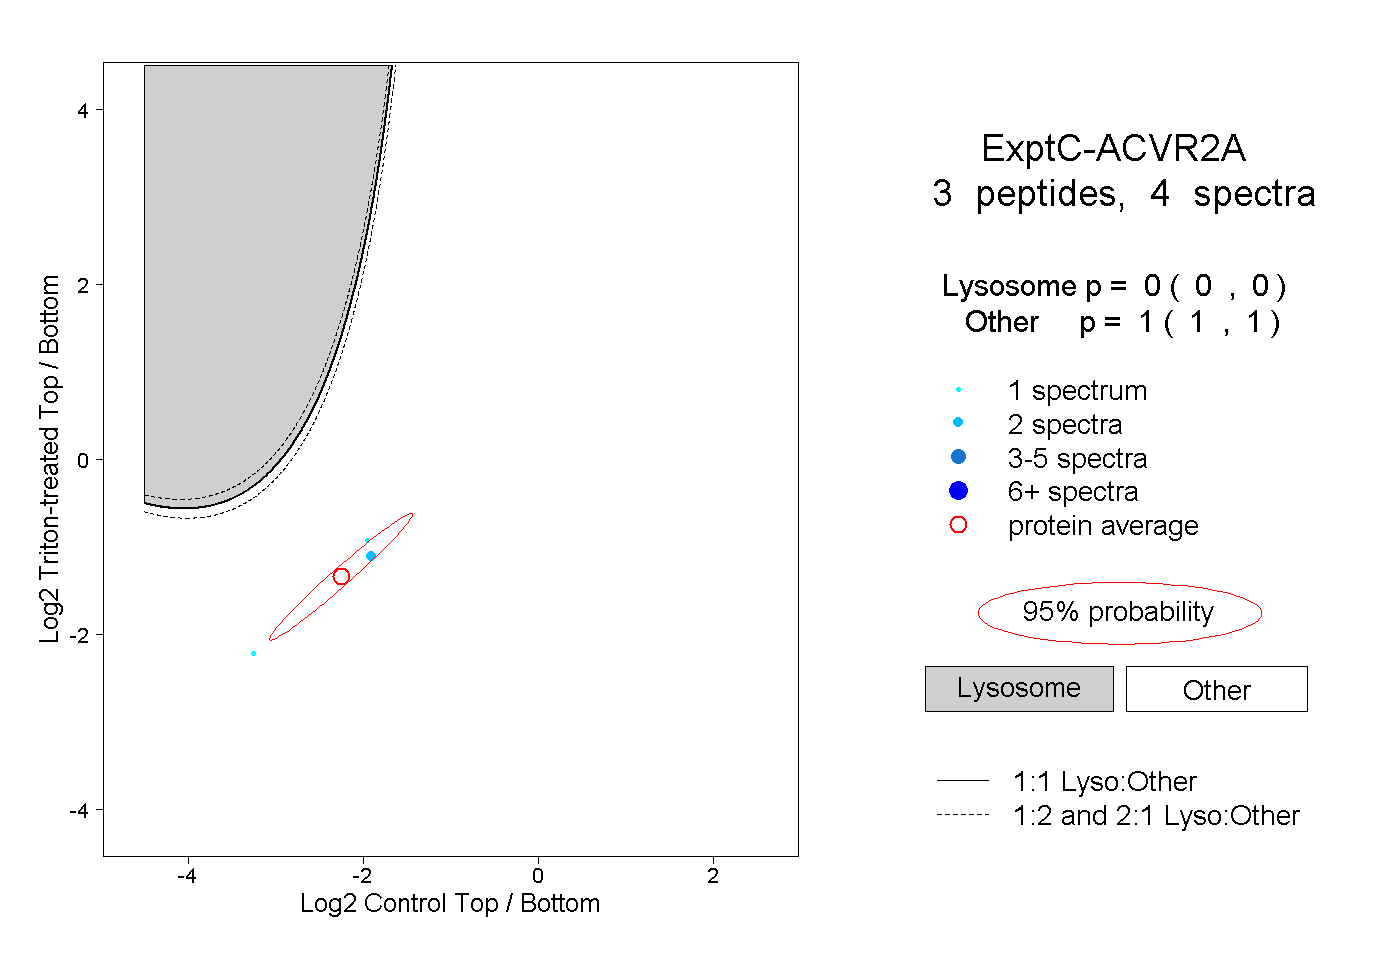
| Plot | Lyso | Other | |||||||||||
| Expt C |
3 peptides |
4 spectra |
|
0.000 0.000 | 0.000 |
1.000 1.000 | 1.000 |
| 1 spectrum, GSLSDFLK | 0.000 | 1.000 | ||||||||
| 1 spectrum, GLAYLHEDIPGLK | 0.000 | 1.000 | ||||||||
| 2 spectra, LSAGCVGER | 0.000 | 1.000 |