 96
96peptides
spectra
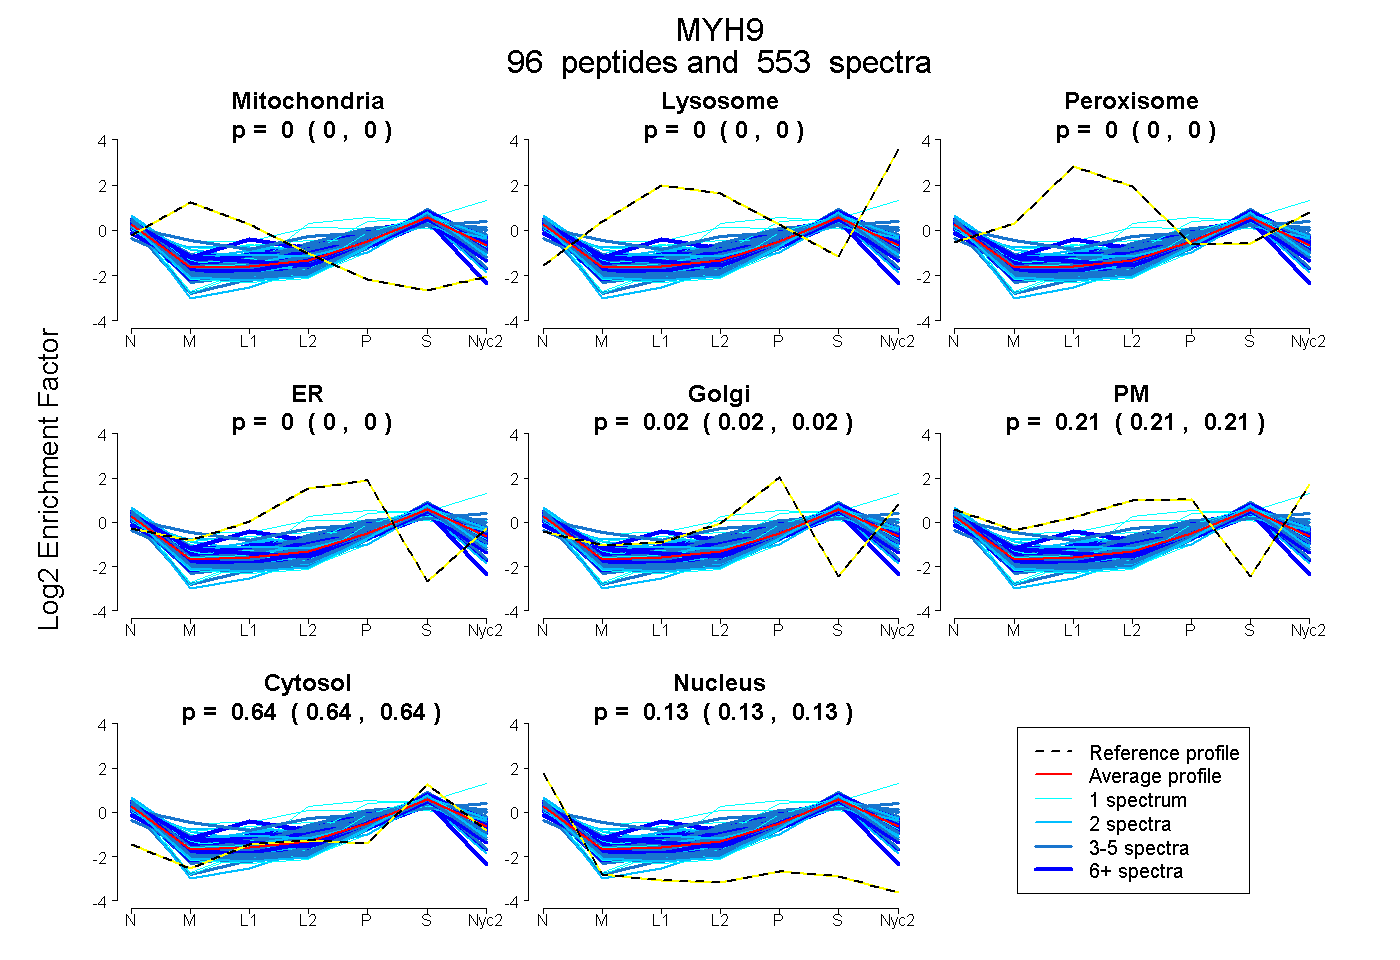
0.000 | 0.000
0.000 | 0.000
0.000 | 0.000
0.000 | 0.000
0.021 | 0.023
0.205 | 0.207
0.637 | 0.638
0.133 | 0.134
40peptides
spectra
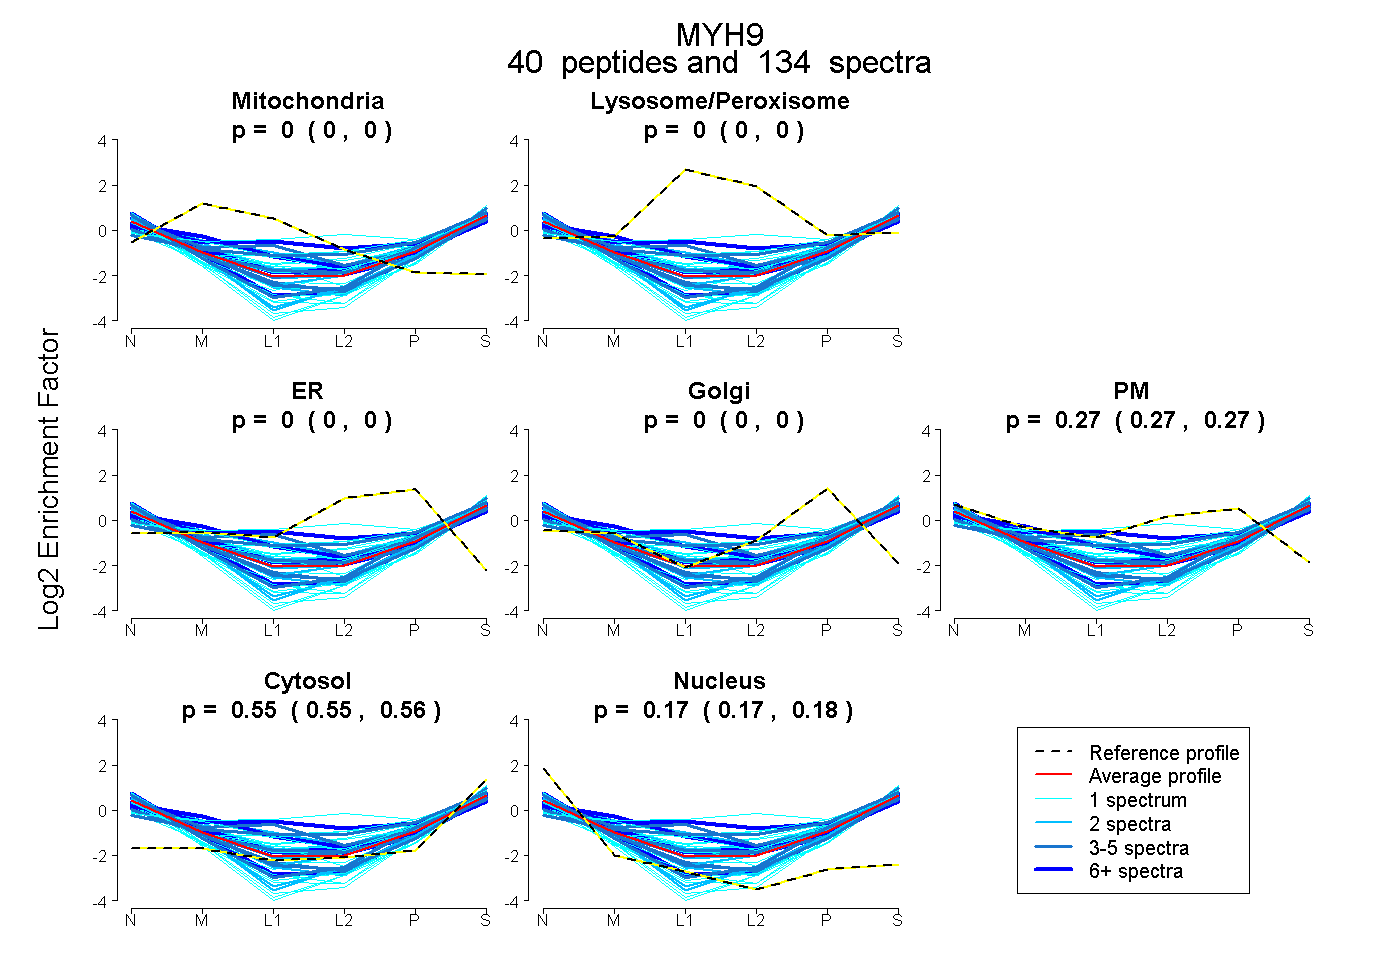
0.000 | 0.000
0.000 | 0.000
0.000 | 0.000
0.000 | 0.000
0.269 | 0.275
0.553 | 0.555
0.171 | 0.176
82peptides
spectra

0.000 | 0.000
1.000 | 1.000
23peptides
spectra
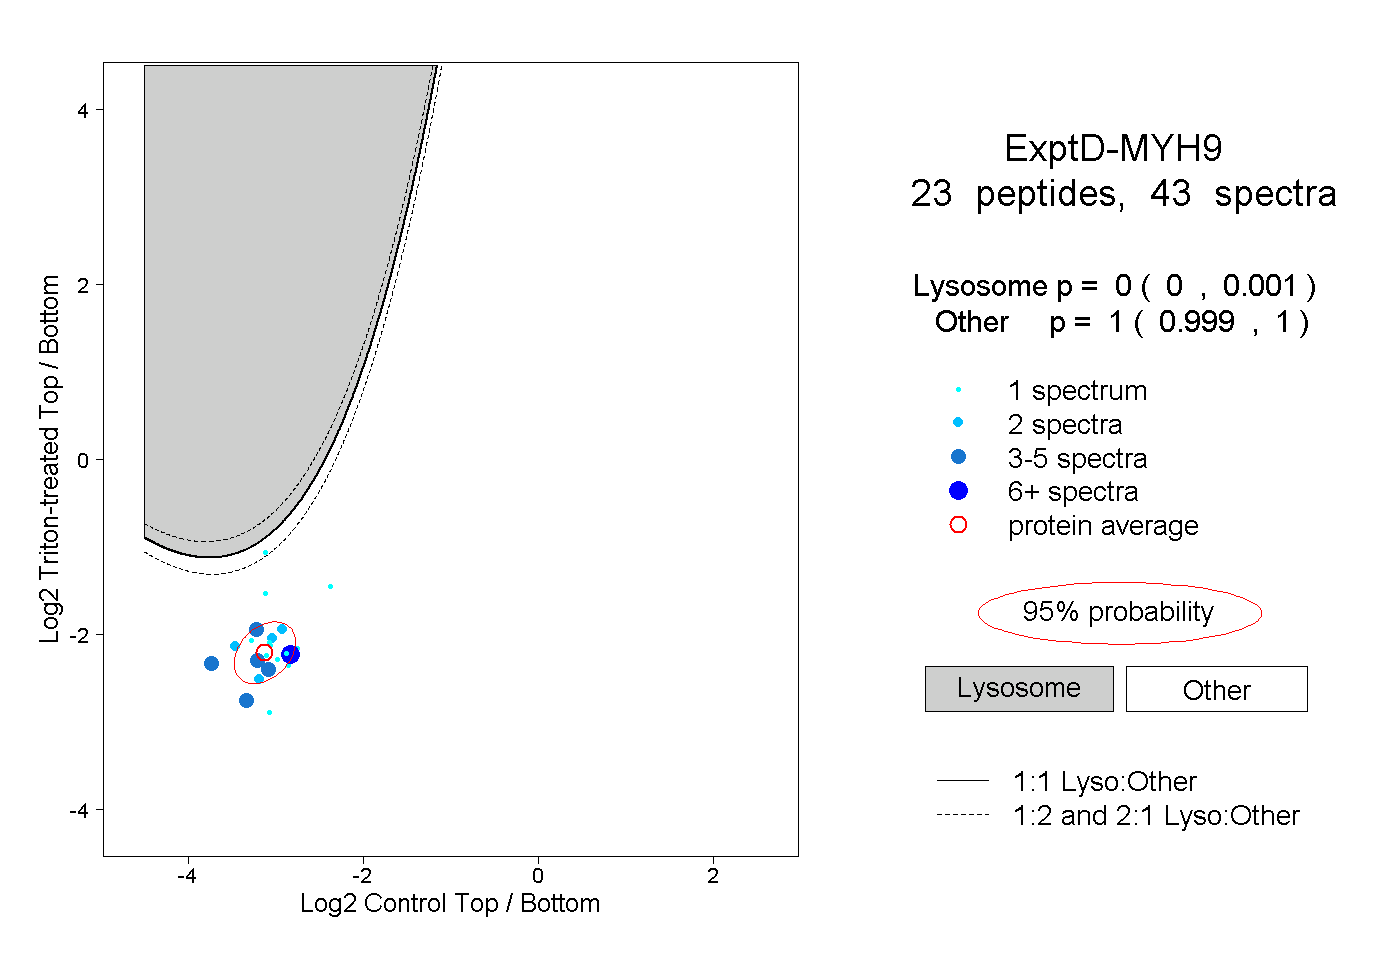
0.000 | 0.001
0.999 | 1.000