 155
155peptides
spectra
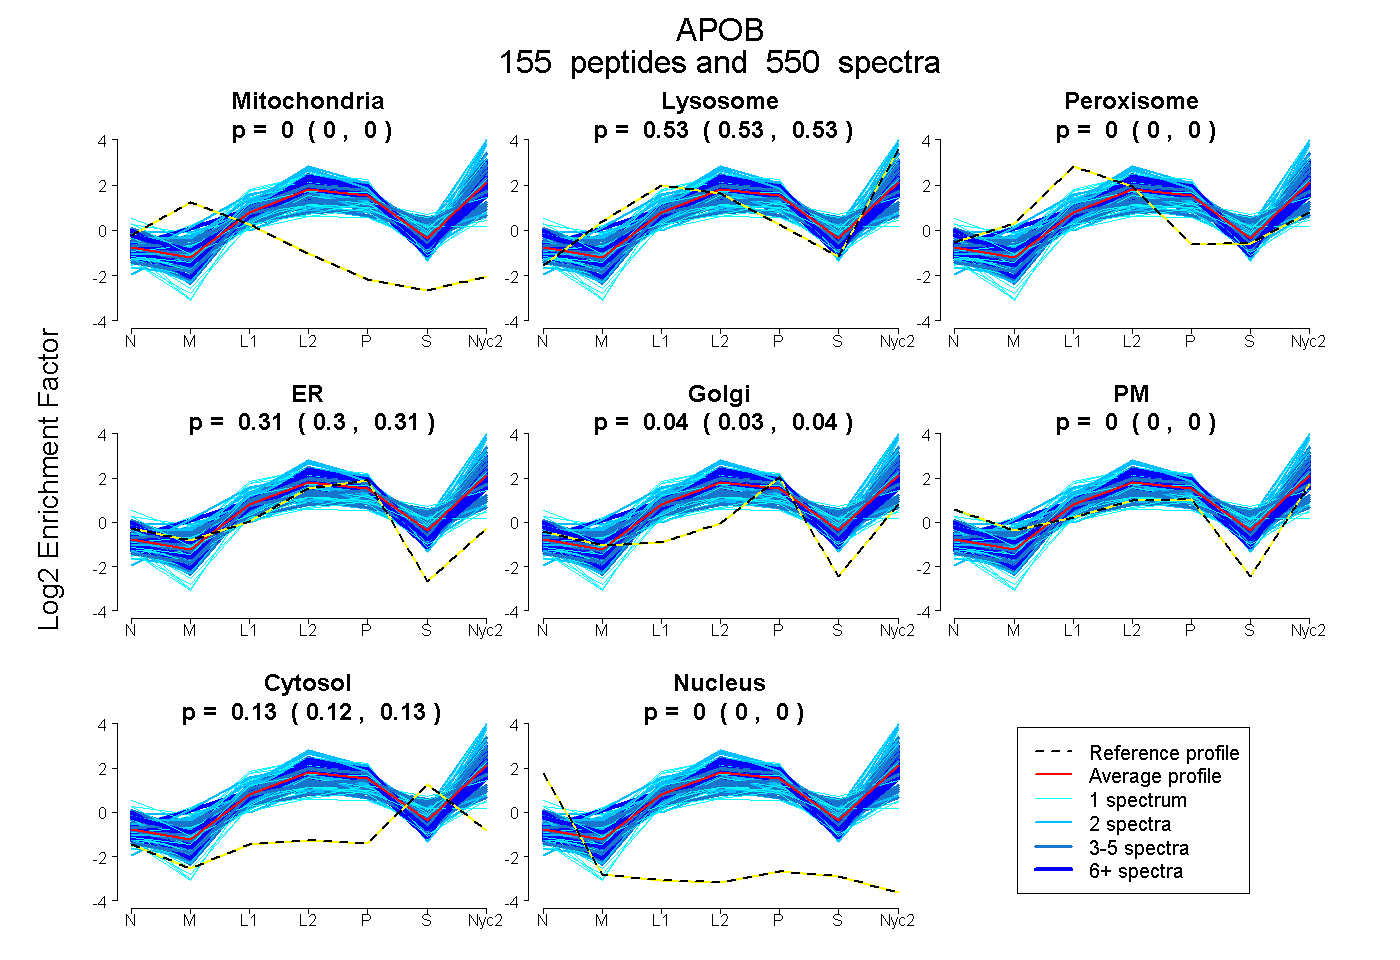
0.000 | 0.000
0.533 | 0.535
0.000 | 0.000
0.304 | 0.307
0.033 | 0.036
0.000 | 0.000
0.125 | 0.126
0.000 | 0.000
72peptides
spectra
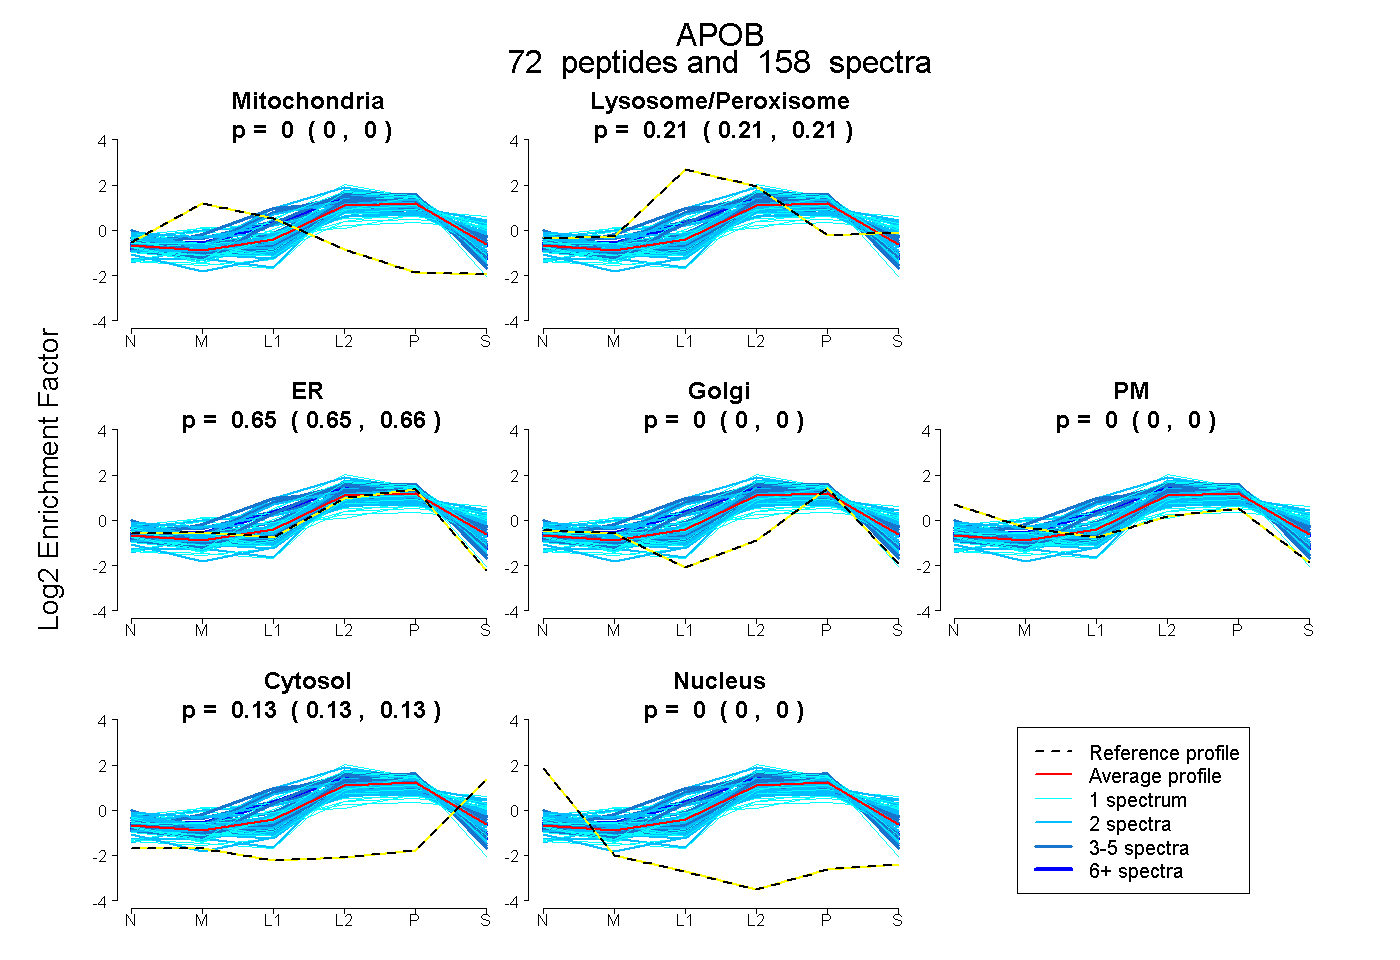
0.000 | 0.000
0.210 | 0.215
0.651 | 0.656
0.000 | 0.000
0.000 | 0.000
0.132 | 0.135
0.000 | 0.000
179peptides
spectra
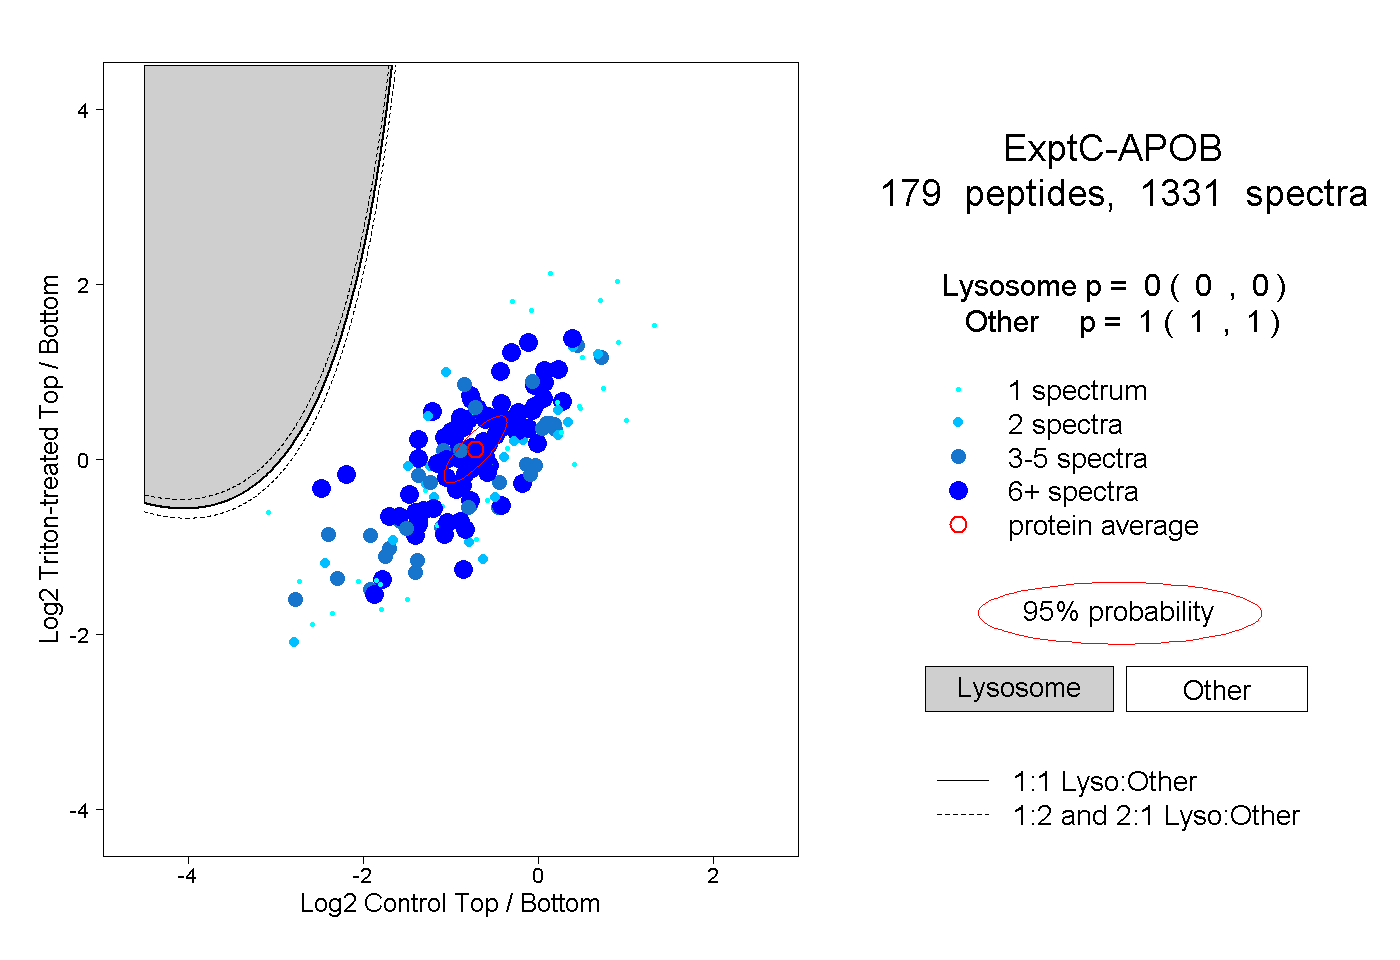
0.000 | 0.000
1.000 | 1.000
66peptides
spectra
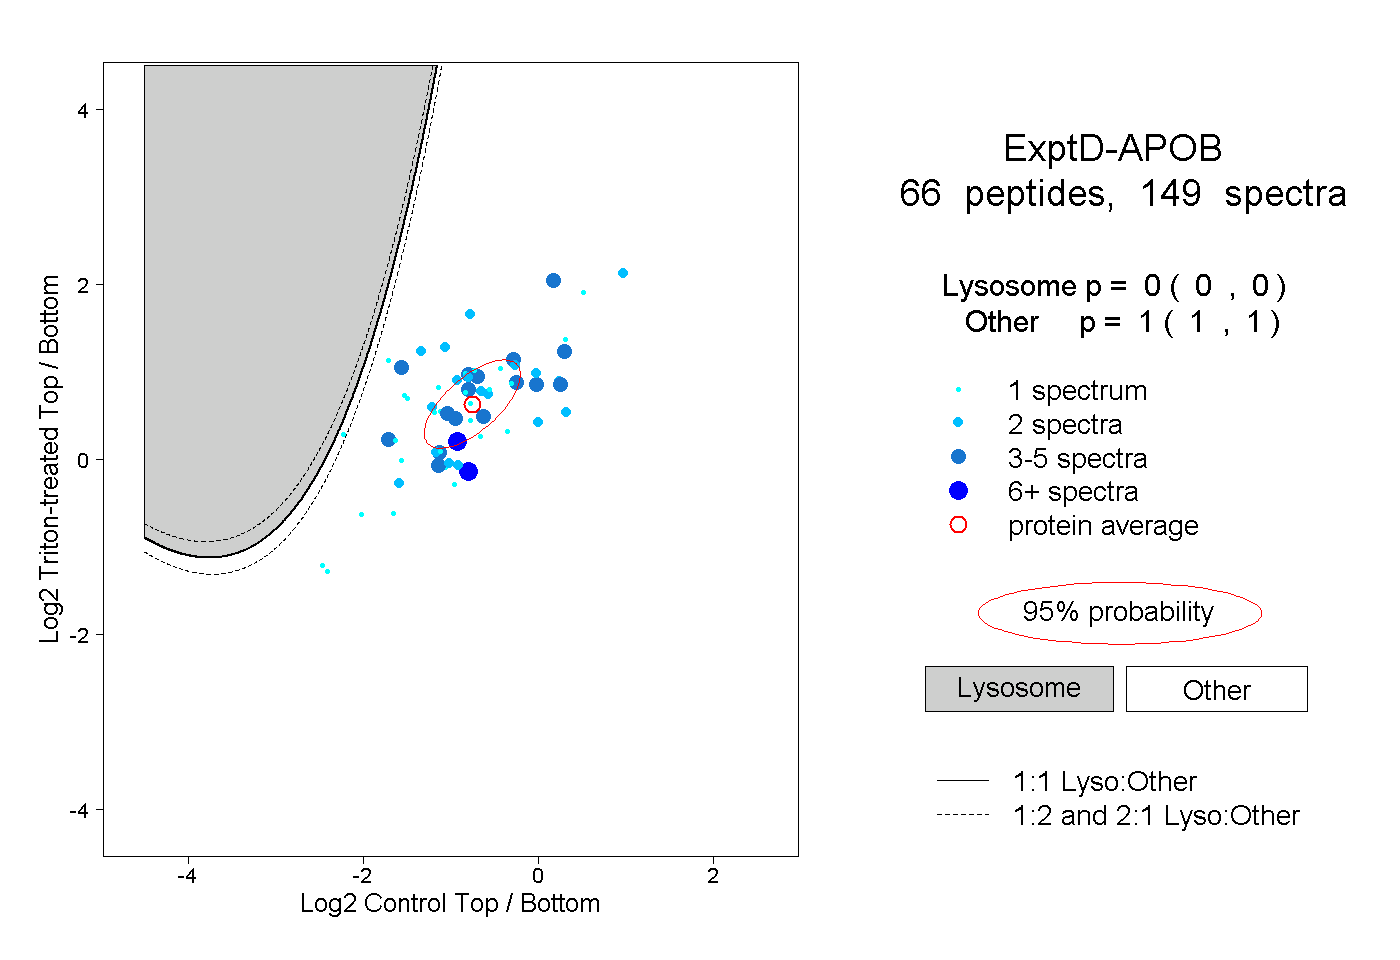
0.000 | 0.000
1.000 | 1.000