 6
6peptides
spectra
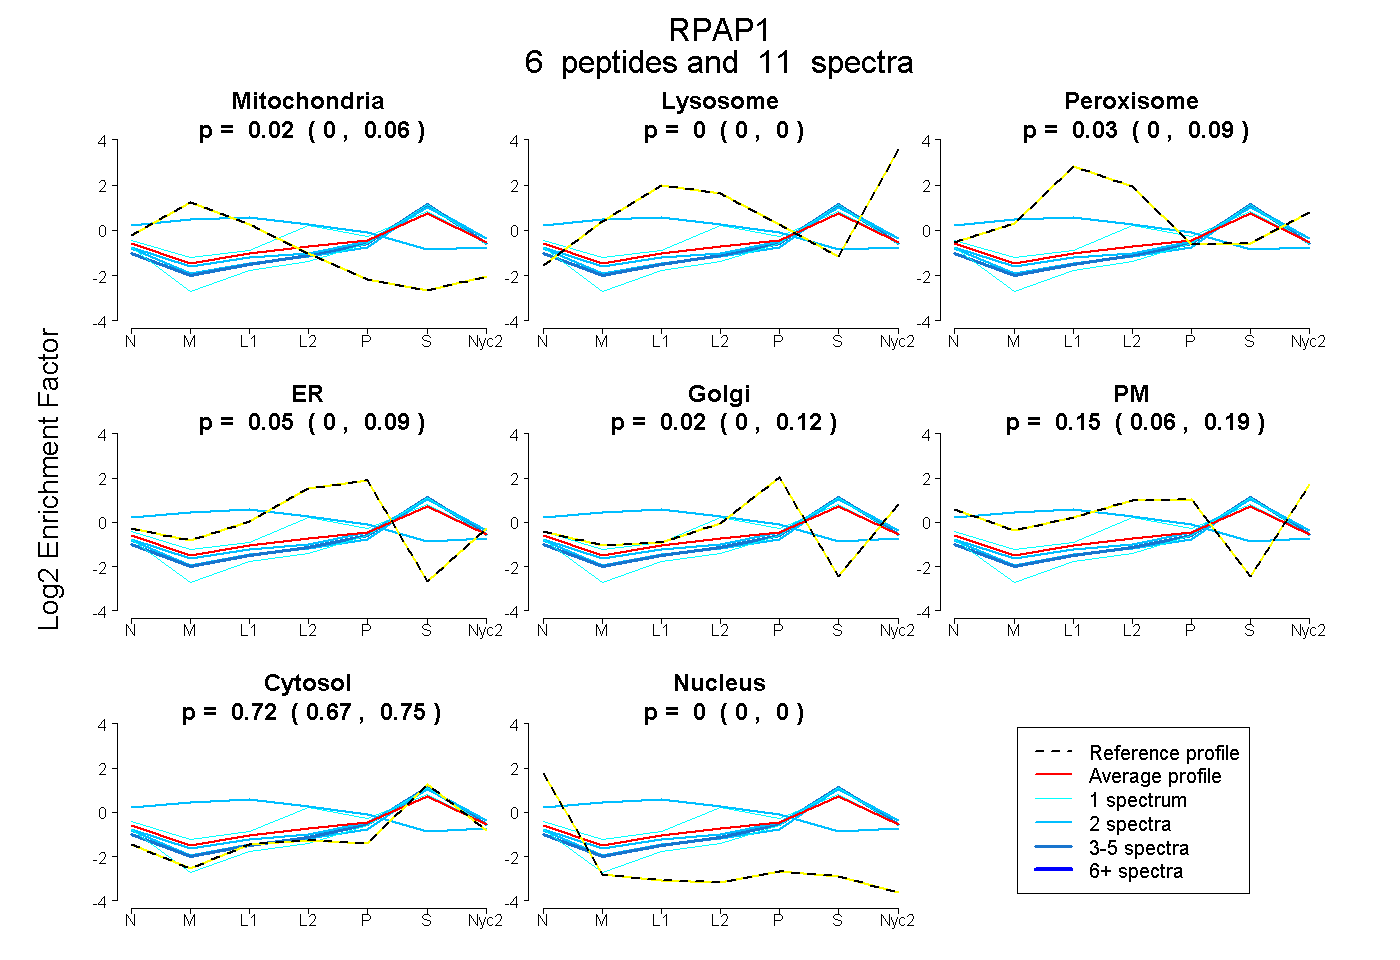
0.000 | 0.057
0.000 | 0.000
0.000 | 0.094
0.000 | 0.092
0.000 | 0.117
0.056 | 0.189
0.667 | 0.748
0.000 | 0.004
1peptide
spectra
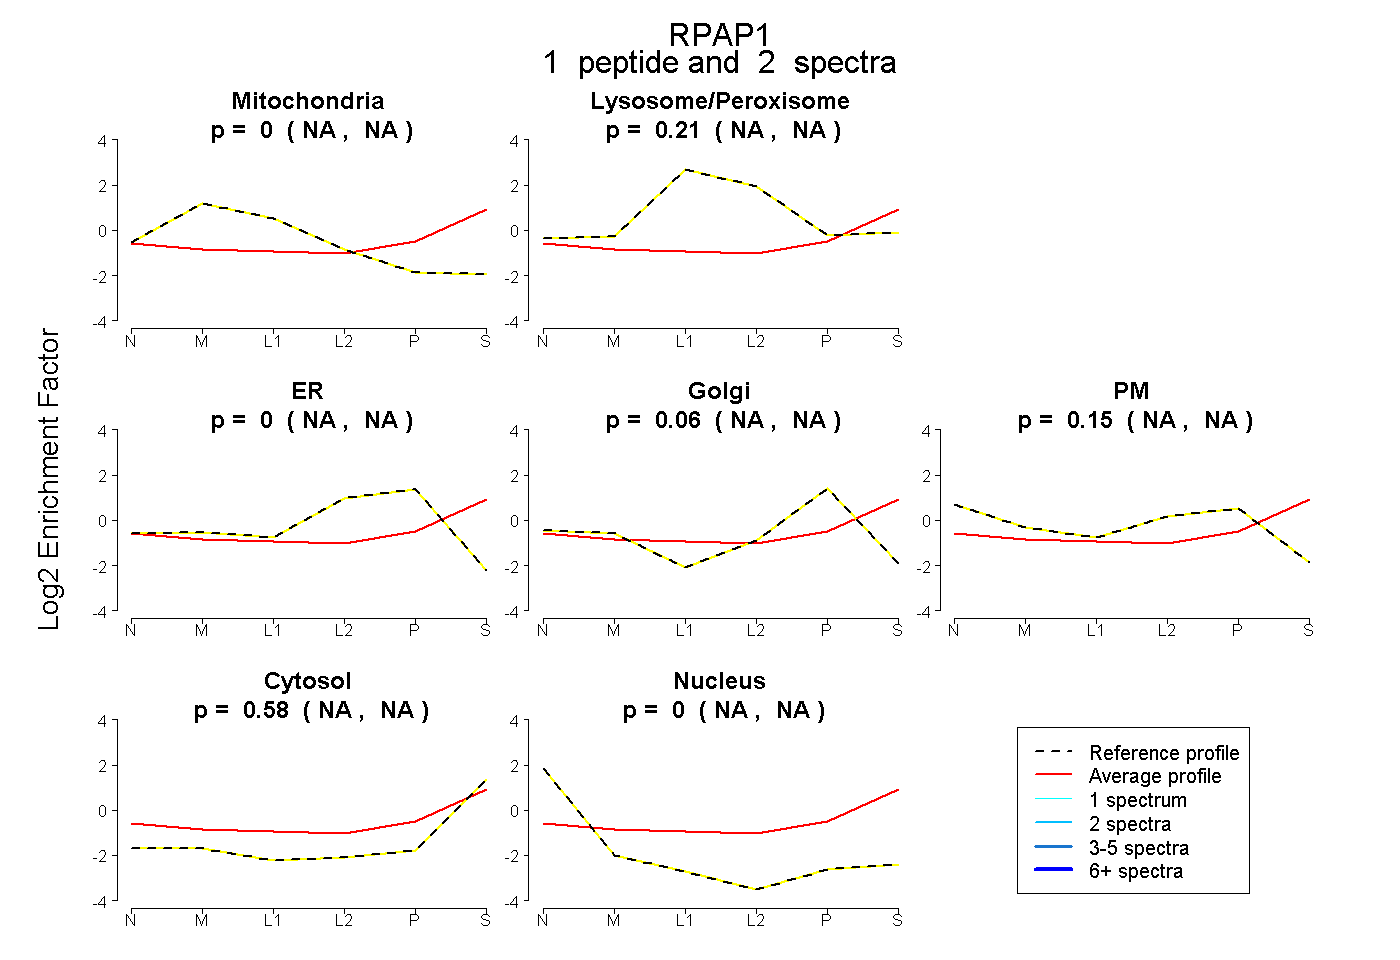
NA | NA
NA | NA
NA | NA
NA | NA
NA | NA
NA | NA
NA | NA
4peptides
spectra
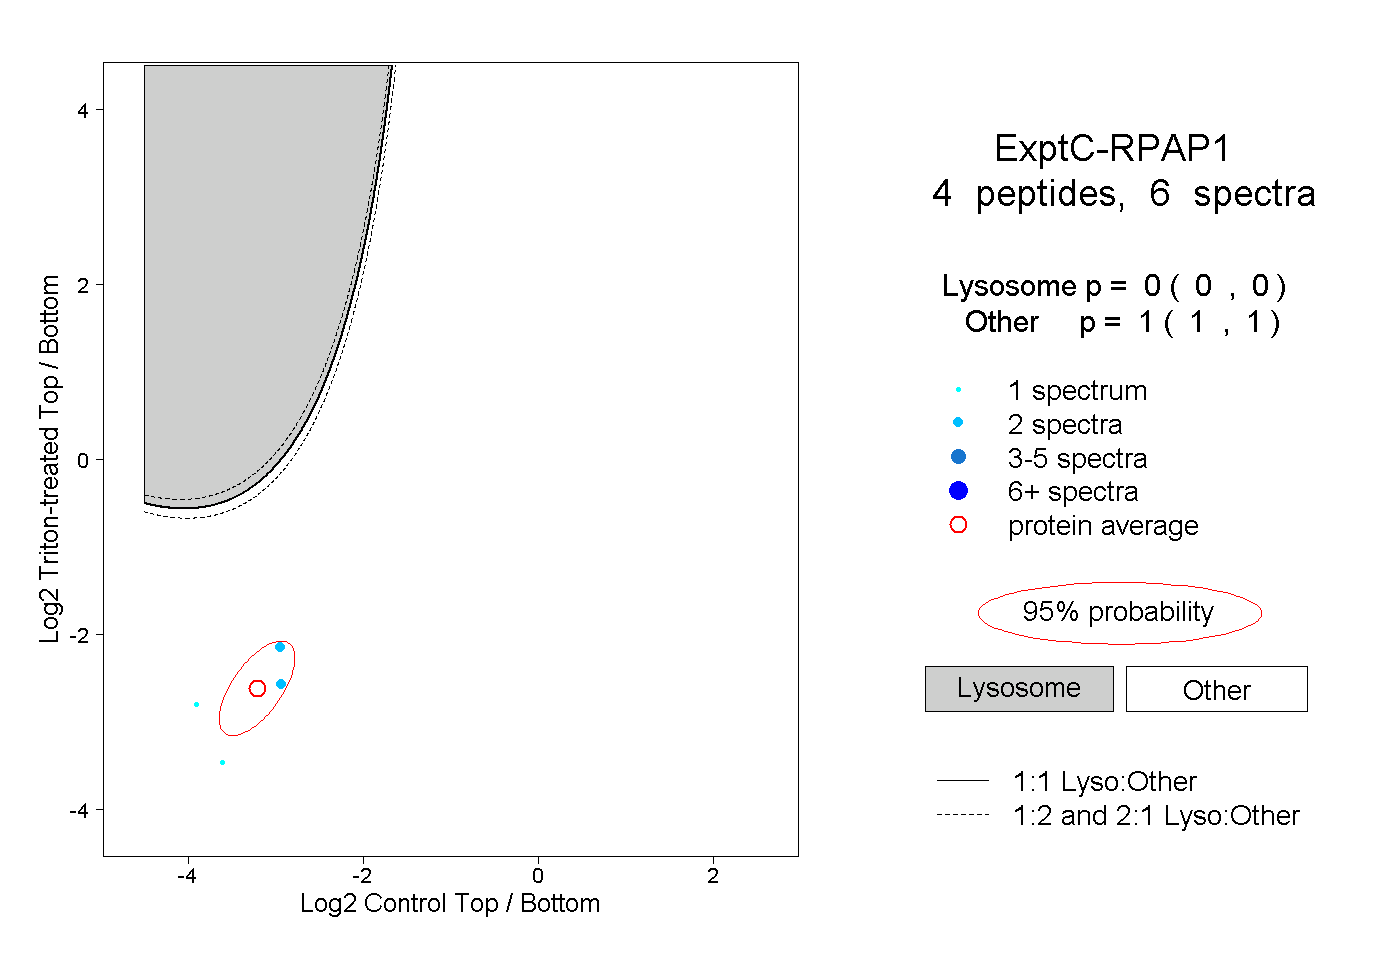
0.000 | 0.000
1.000 | 1.000
1peptide
spectra
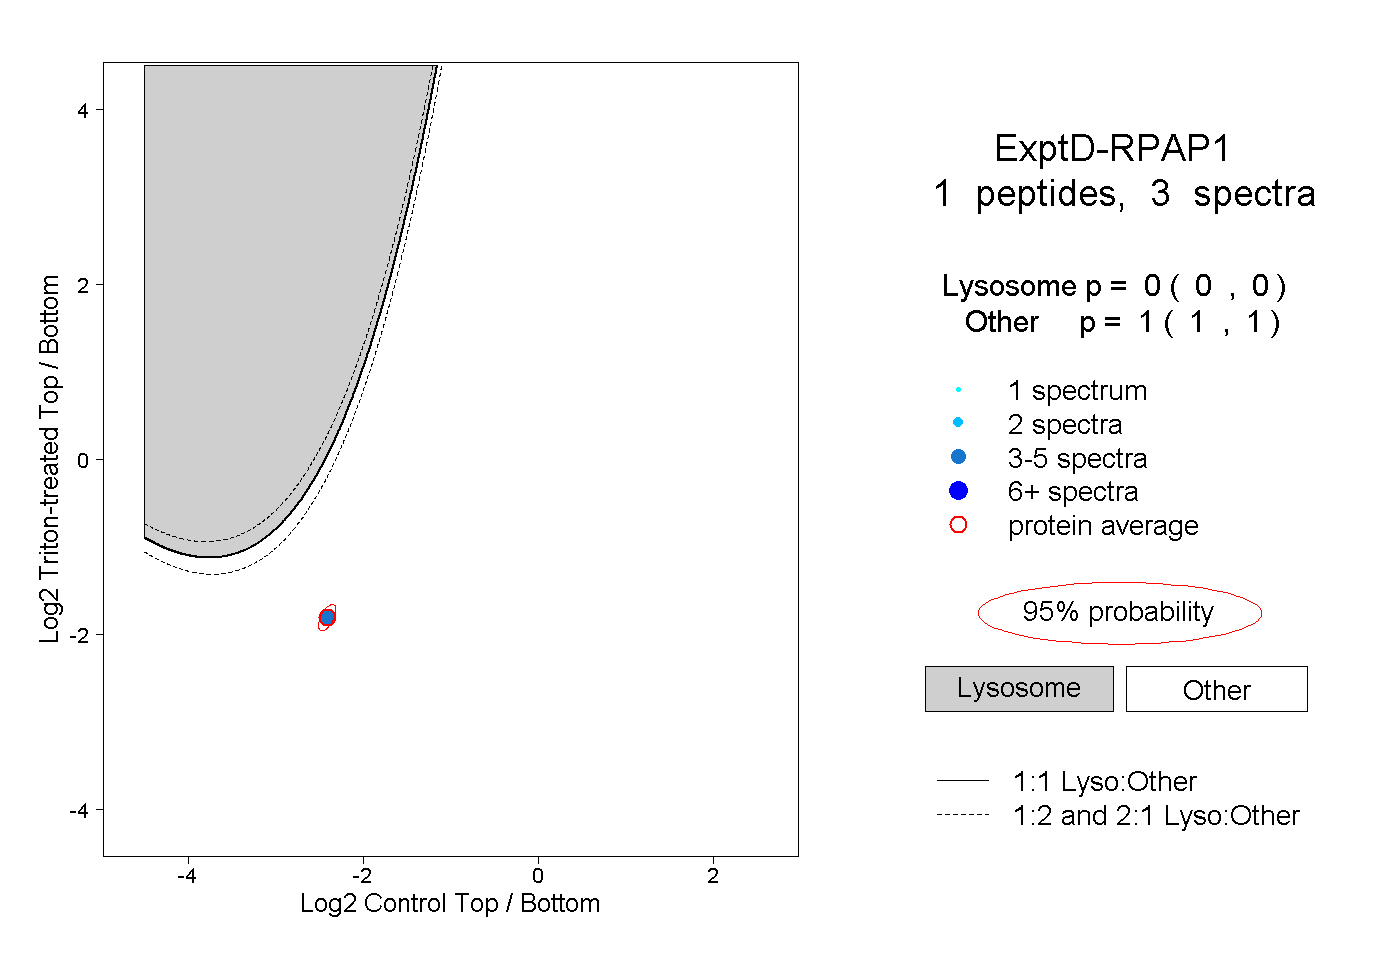
0.000 | 0.000
1.000 | 1.000