 5
5peptides
spectra
0.000 | 0.000
0.000 | 0.000
0.015 | 0.044
0.000 | 0.000
0.000 | 0.000
0.008 | 0.033
0.837 | 0.857
0.093 | 0.105
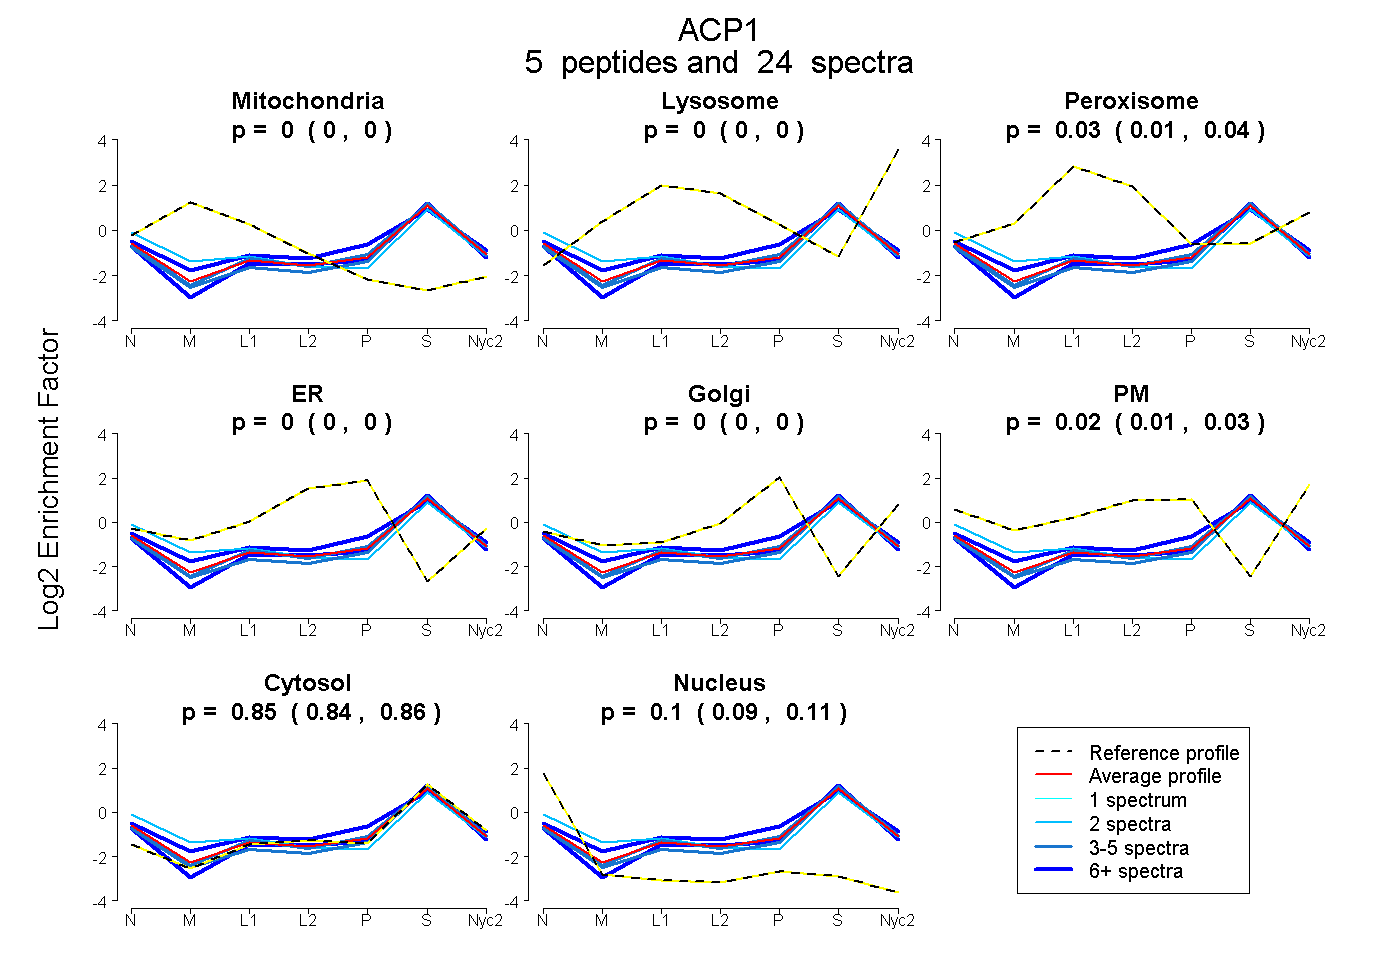
| Plot | Mito | Lyso | Perox | ER | Golgi | PM | Cytosol | Nucleus | |||||
| Expt A |
5 peptides |
24 spectra |
|
0.000 0.000 | 0.000 |
0.000 0.000 | 0.000 |
0.031 0.015 | 0.044 |
0.000 0.000 | 0.000 |
0.000 0.000 | 0.000 |
0.021 0.008 | 0.033 |
0.848 0.837 | 0.857 |
0.100 0.093 | 0.105 |
| 5 spectra, SPIAEAVFR | 0.000 | 0.000 | 0.024 | 0.000 | 0.018 | 0.002 | 0.870 | 0.086 | ||
| 4 spectra, LVTDENVSDNWR | 0.000 | 0.000 | 0.000 | 0.000 | 0.000 | 0.000 | 0.897 | 0.103 | ||
| 6 spectra, HGIHMQHIAR | 0.012 | 0.000 | 0.062 | 0.000 | 0.101 | 0.018 | 0.754 | 0.053 | ||
| 7 spectra, GQNCMK | 0.000 | 0.000 | 0.000 | 0.000 | 0.000 | 0.000 | 0.905 | 0.095 | ||
| 2 spectra, IELLGSYDPQK | 0.158 | 0.000 | 0.033 | 0.000 | 0.000 | 0.000 | 0.718 | 0.091 |
| Plot | Mito | Lyso or Perox | ER | Golgi | PM | Cytosol | Nucleus | ||||||
| Expt B |
5 peptides |
7 spectra |
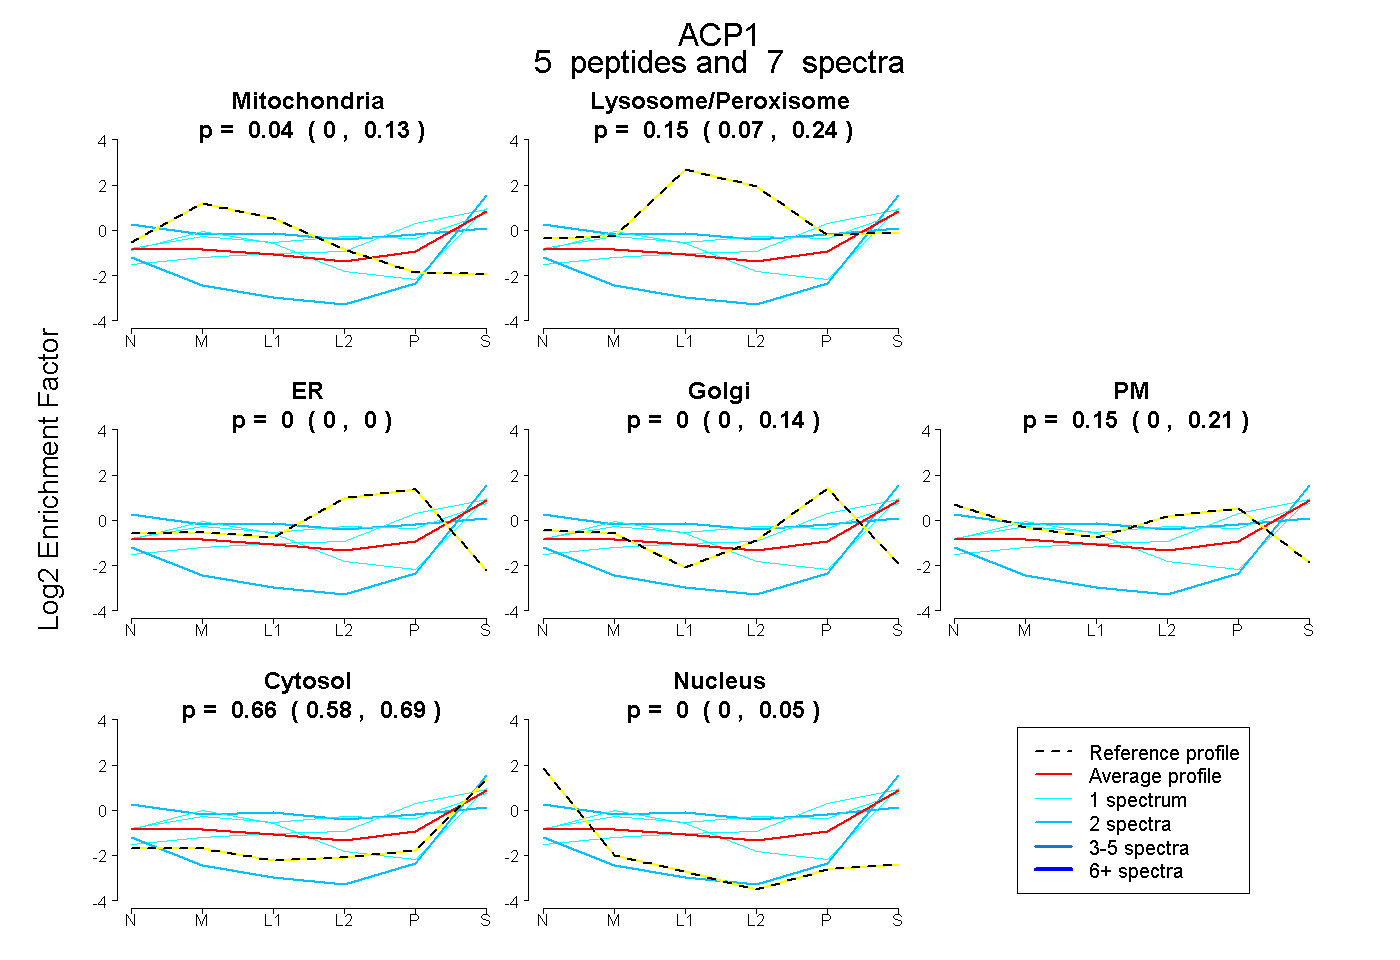 |
0.037 0.000 | 0.126 |
0.152 0.074 | 0.243 |
0.000 0.000 | 0.000 |
0.000 0.000 | 0.143 |
0.155 0.000 | 0.211 |
0.656 0.584 | 0.686 |
0.000 0.000 | 0.049 |
|||
| Plot | Lyso | Other | |||||||||||
| Expt C |
3 peptides |
7 spectra |
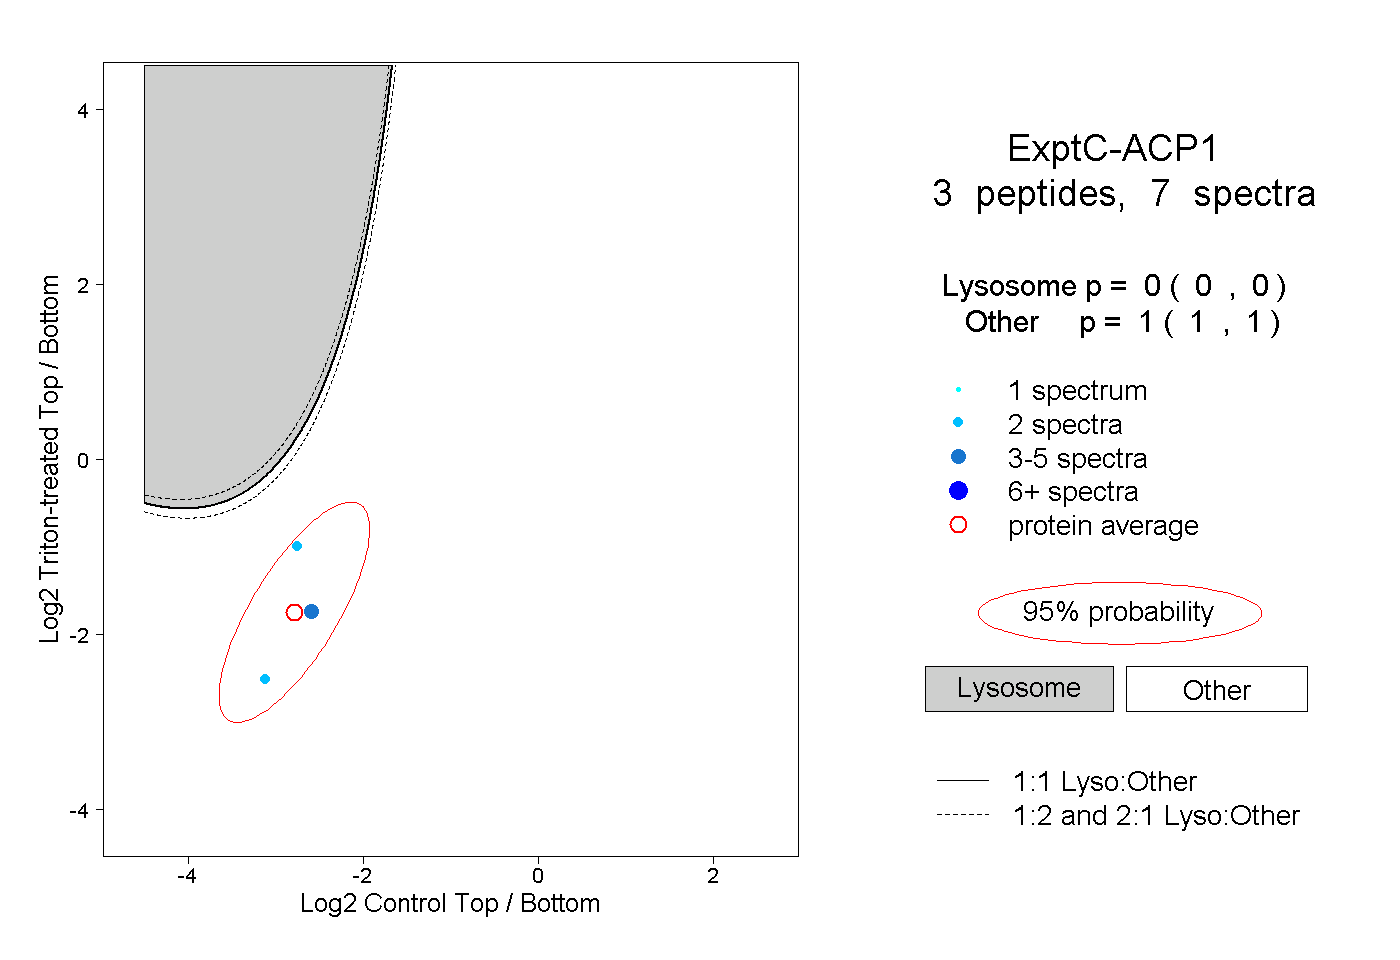 |
0.000 0.000 | 0.000 |
1.000 1.000 | 1.000 |
||||||||
| Plot | Lyso | Other | |||||||||||
| Expt D |
2 peptides |
3 spectra |
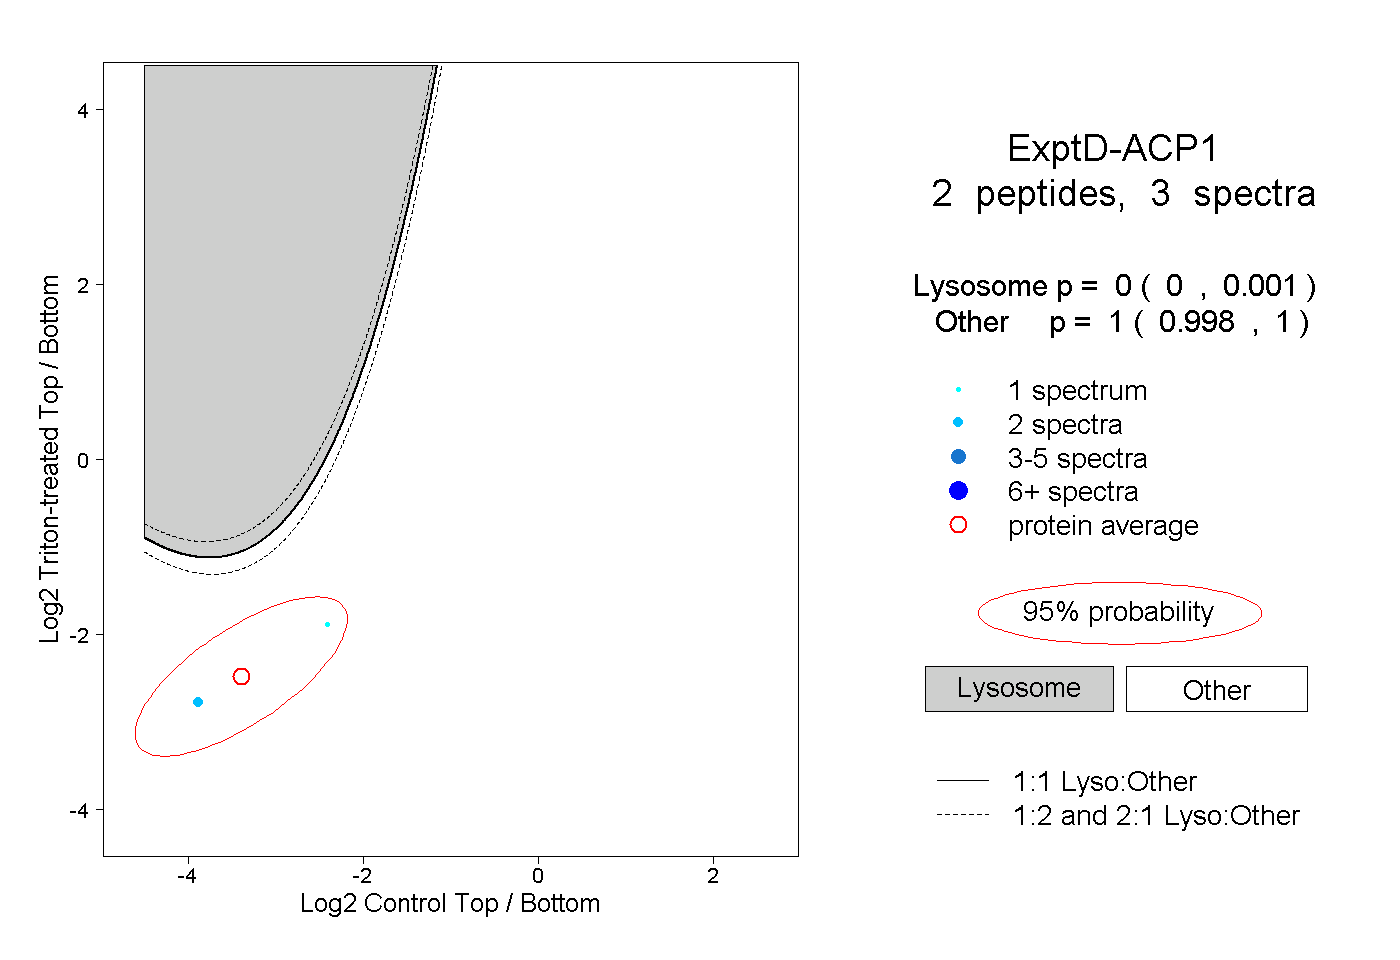 |
0.000 0.000 | 0.001 |
1.000 0.998 | 1.000 |