 6
6peptides
spectra
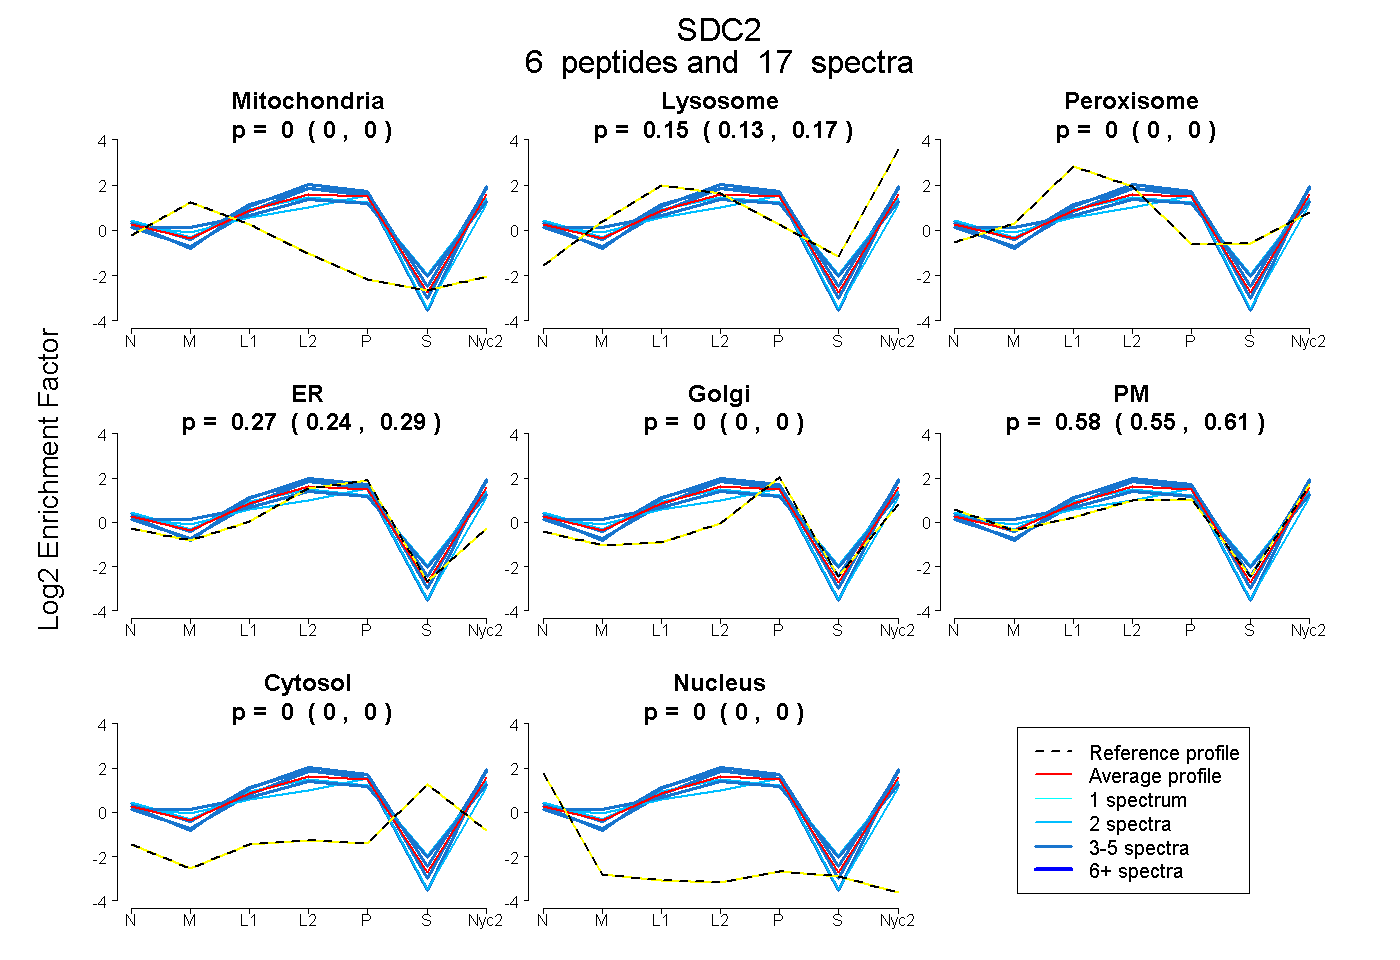
0.000 | 0.000
0.135 | 0.165
0.000 | 0.000
0.245 | 0.290
0.000 | 0.000
0.549 | 0.606
0.000 | 0.000
0.000 | 0.000
4peptides
spectra
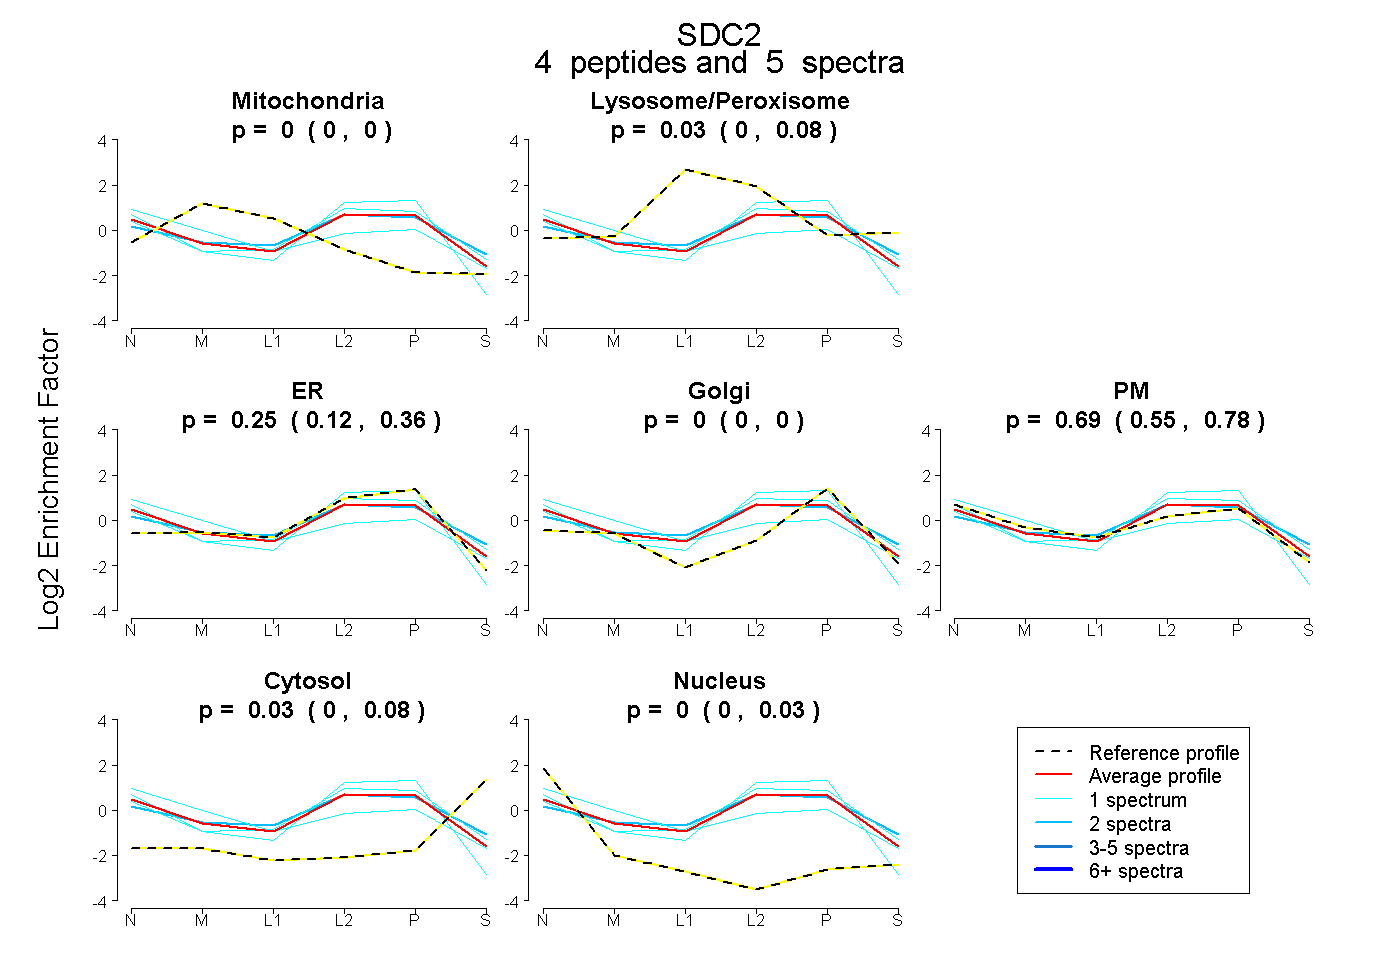
0.000 | 0.000
0.000 | 0.083
0.118 | 0.362
0.000 | 0.000
0.545 | 0.785
0.000 | 0.077
0.000 | 0.029
6peptides
spectra
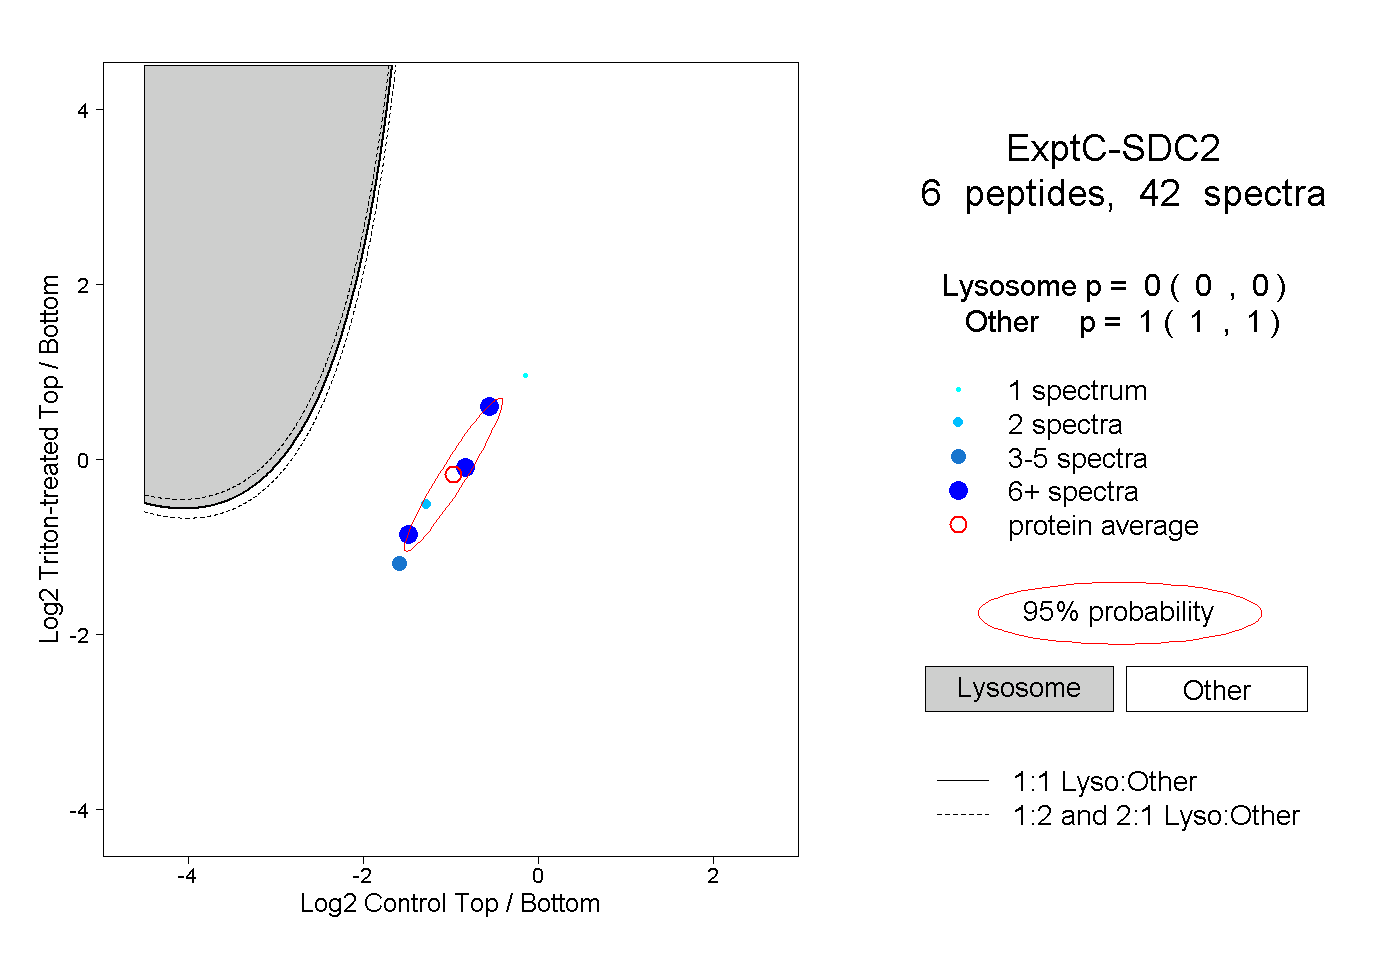
0.000 | 0.000
1.000 | 1.000
2peptides
spectra
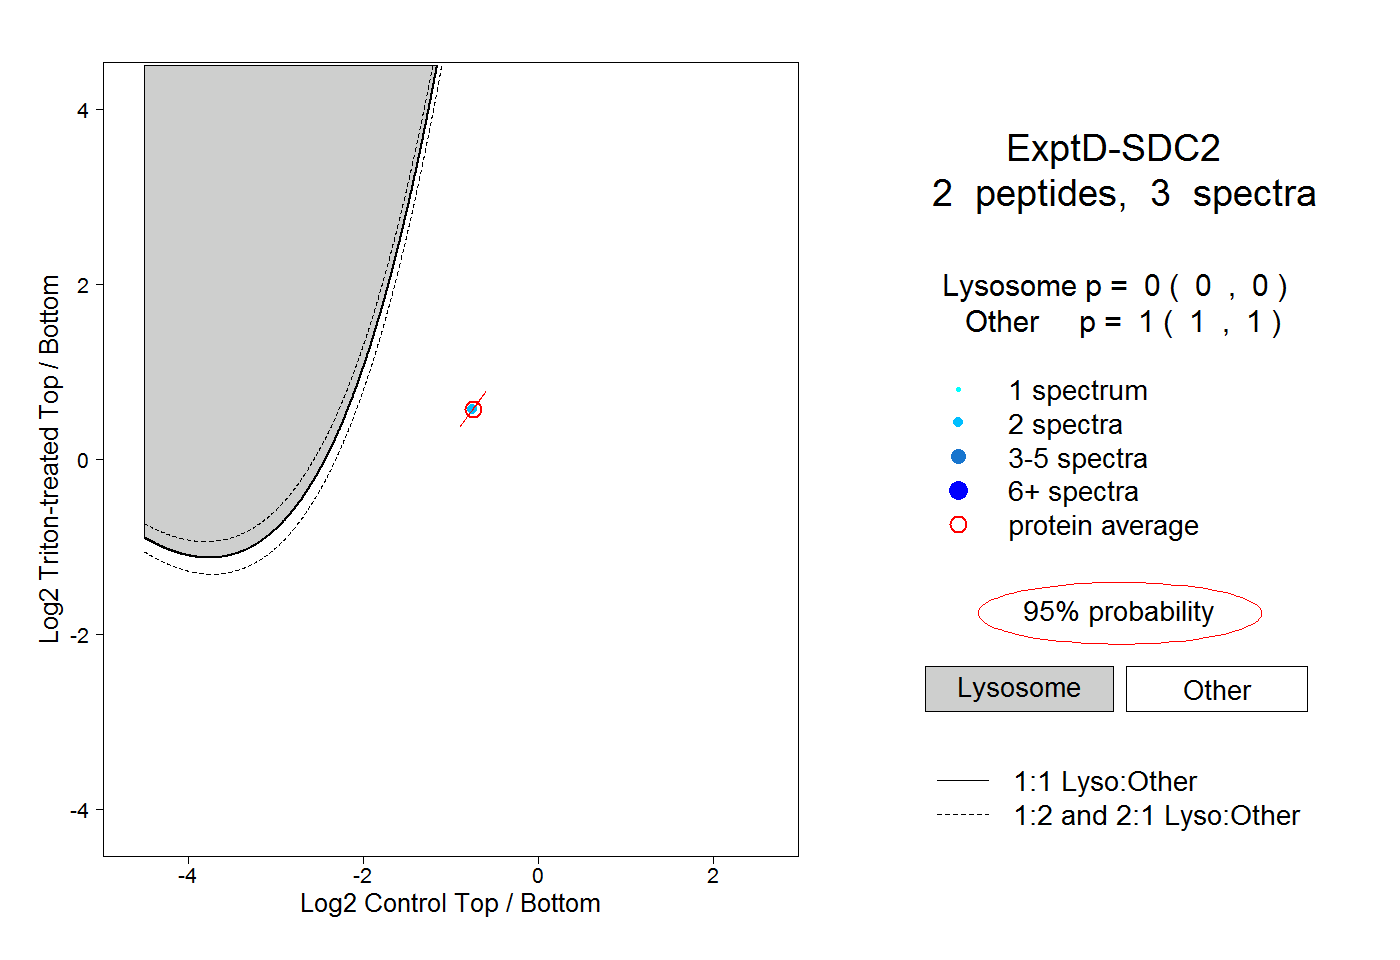
0.000 | 0.000
1.000 | 1.000