 1
1peptide
spectra
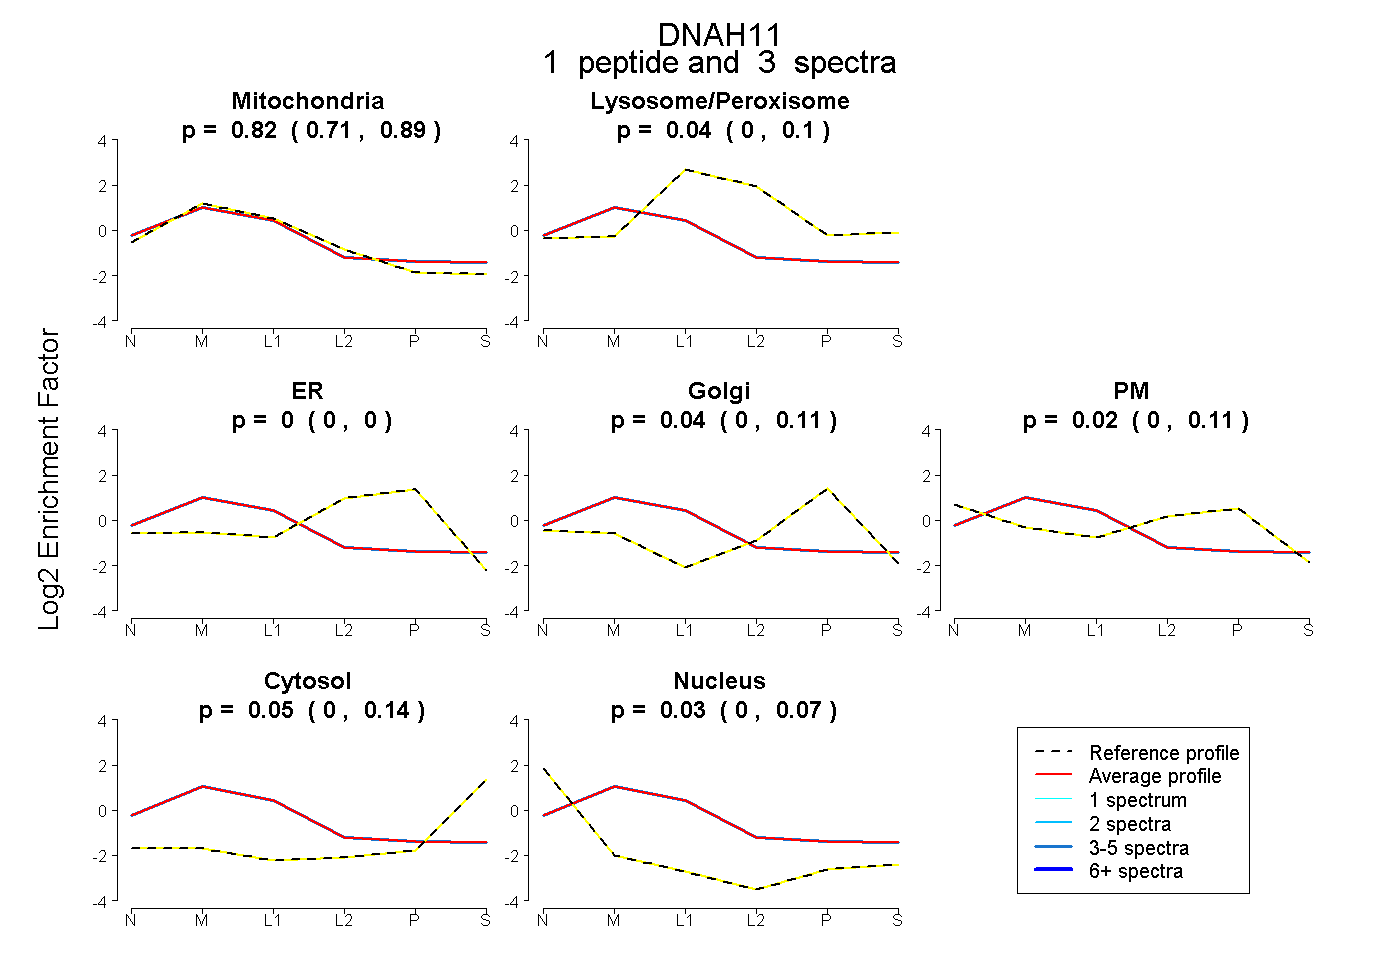
0.706 | 0.890
0.000 | 0.099
0.000 | 0.000
0.000 | 0.110
0.000 | 0.108
0.000 | 0.145
0.000 | 0.074
1peptide
spectra
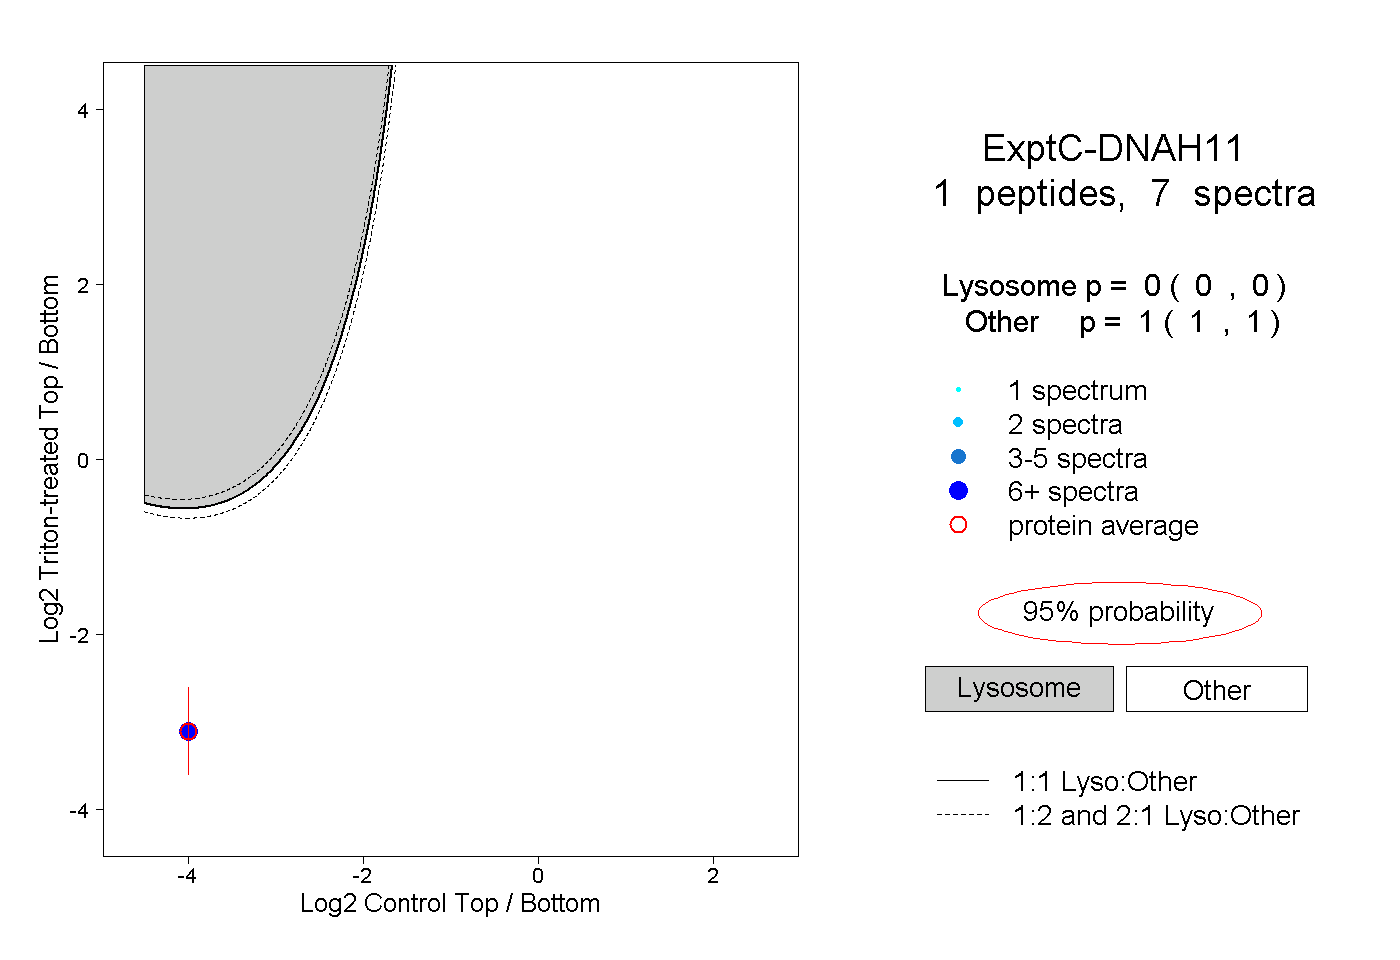
0.000 | 0.000
1.000 | 1.000
1peptide
spectra
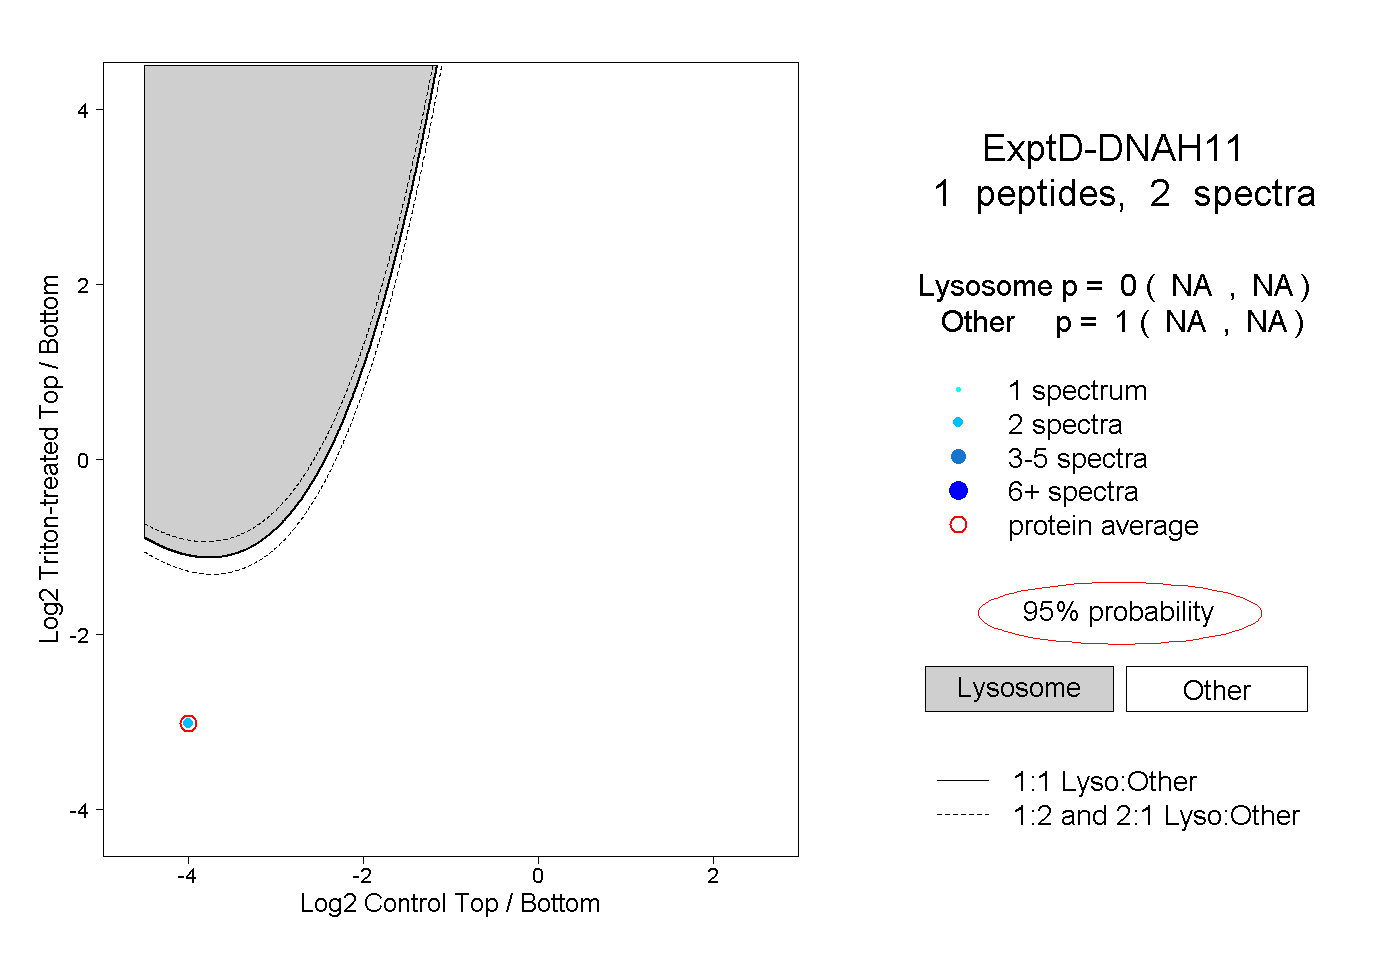
NA | NA
NA | NA