 17
17peptides
spectra

0.032 | 0.040
0.000 | 0.000
0.000 | 0.000
0.960 | 0.967
0.000 | 0.000
0.000 | 0.000
0.000 | 0.000
0.000 | 0.000
7peptides
spectra
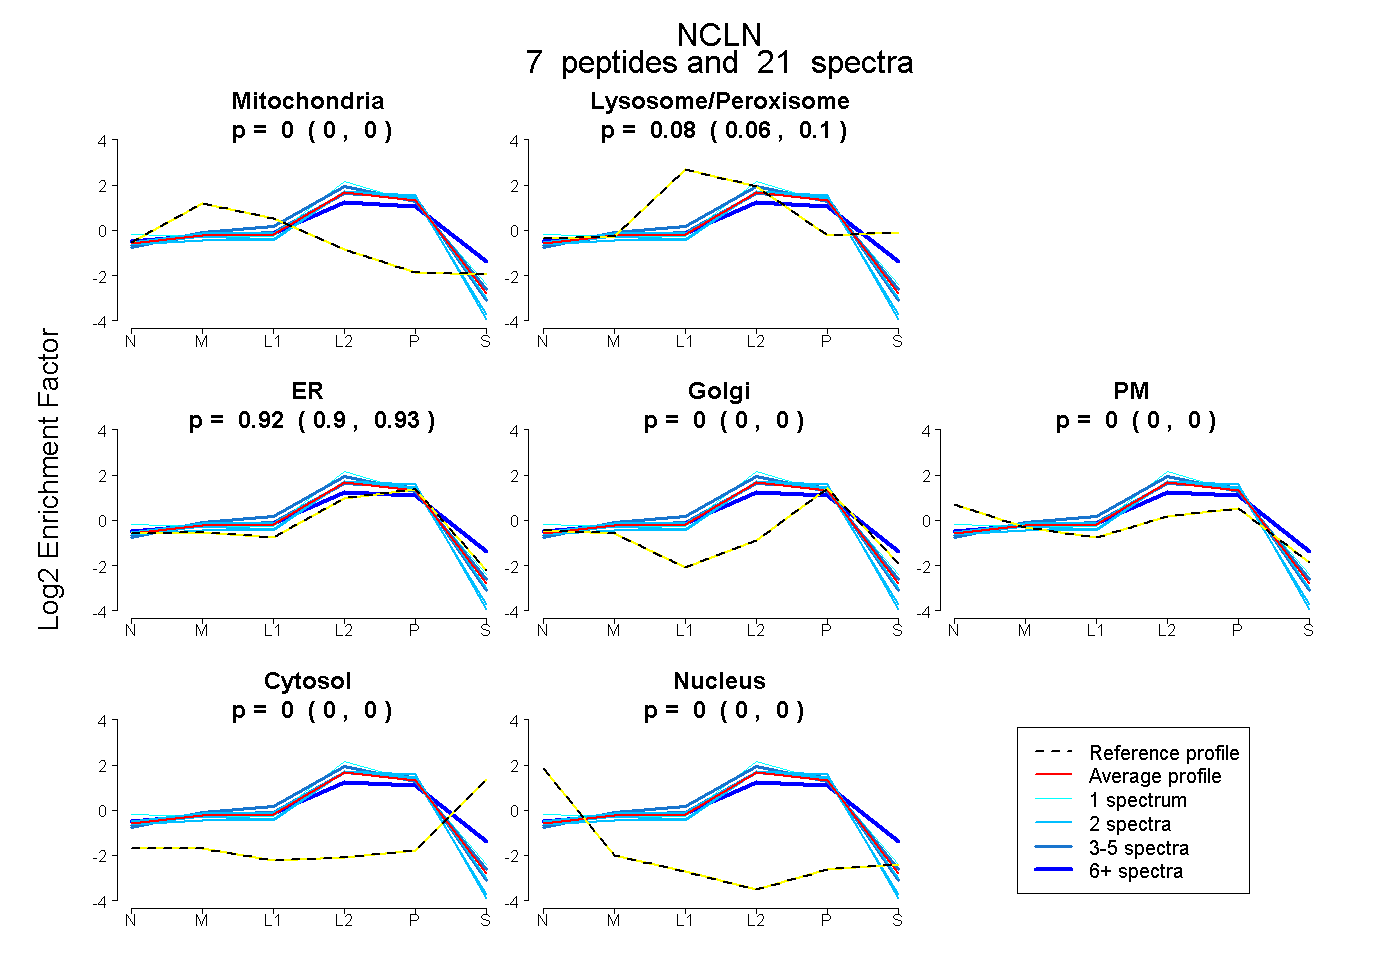
0.000 | 0.000
0.062 | 0.097
0.901 | 0.933
0.000 | 0.000
0.000 | 0.000
0.000 | 0.000
0.000 | 0.000
18peptides
spectra
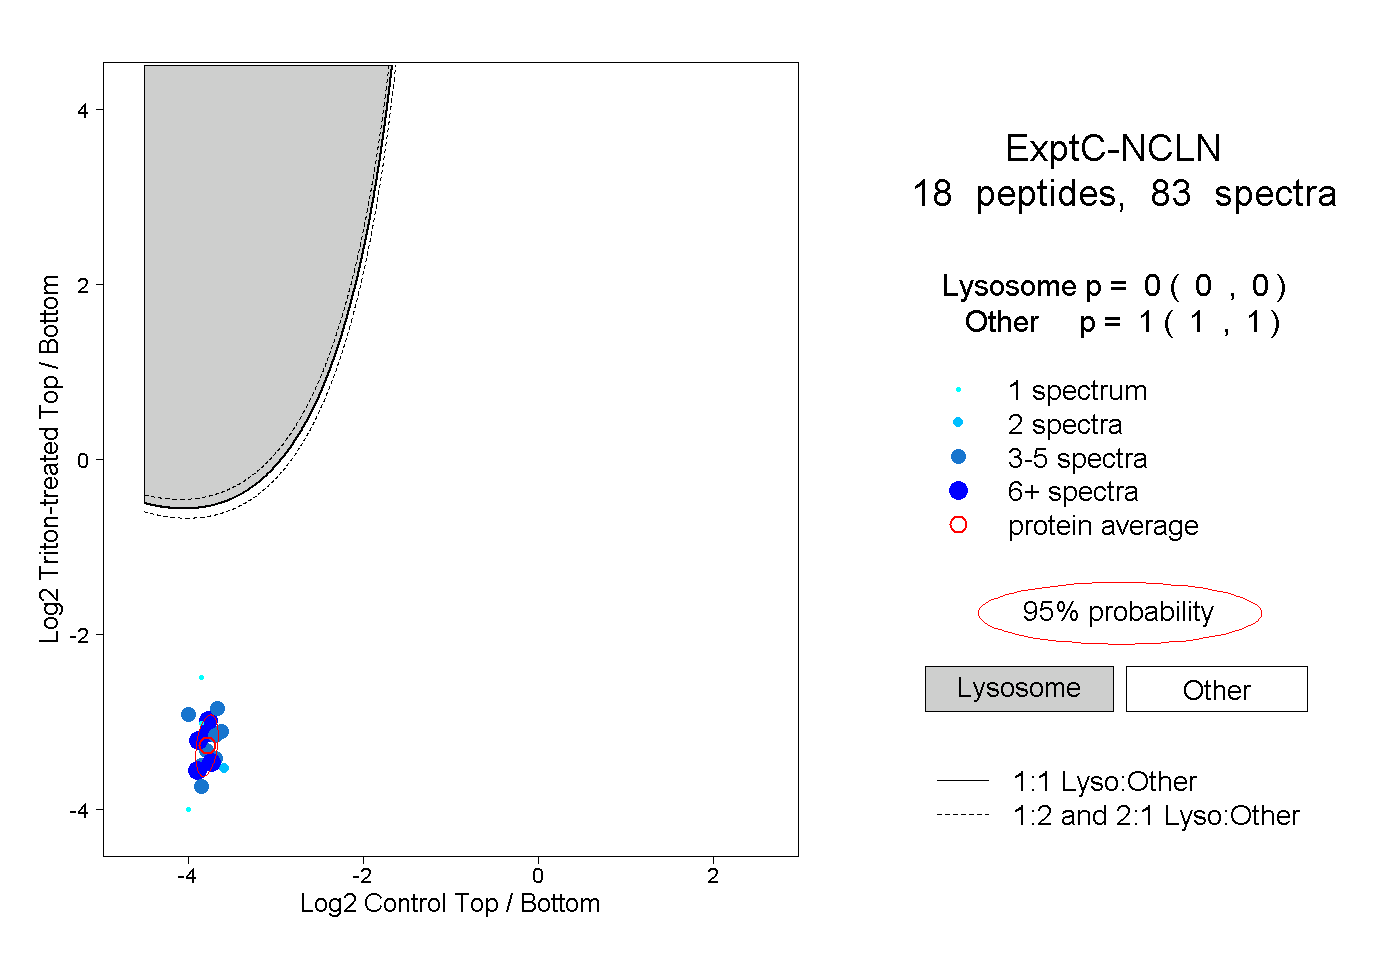
0.000 | 0.000
1.000 | 1.000
5peptides
spectra
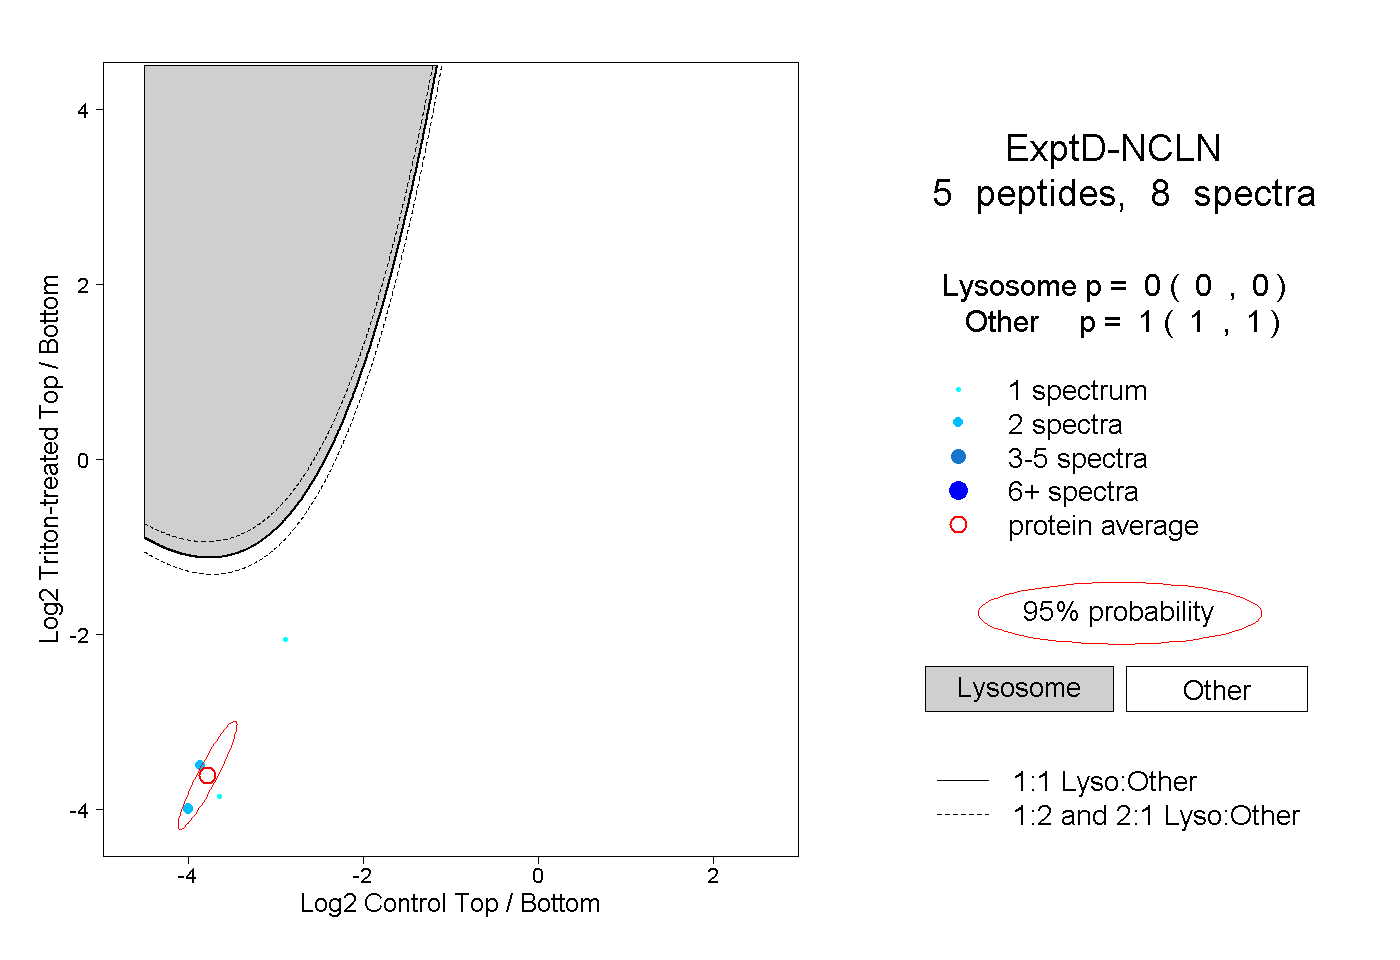
0.000 | 0.000
1.000 | 1.000