 3
3peptides
spectra
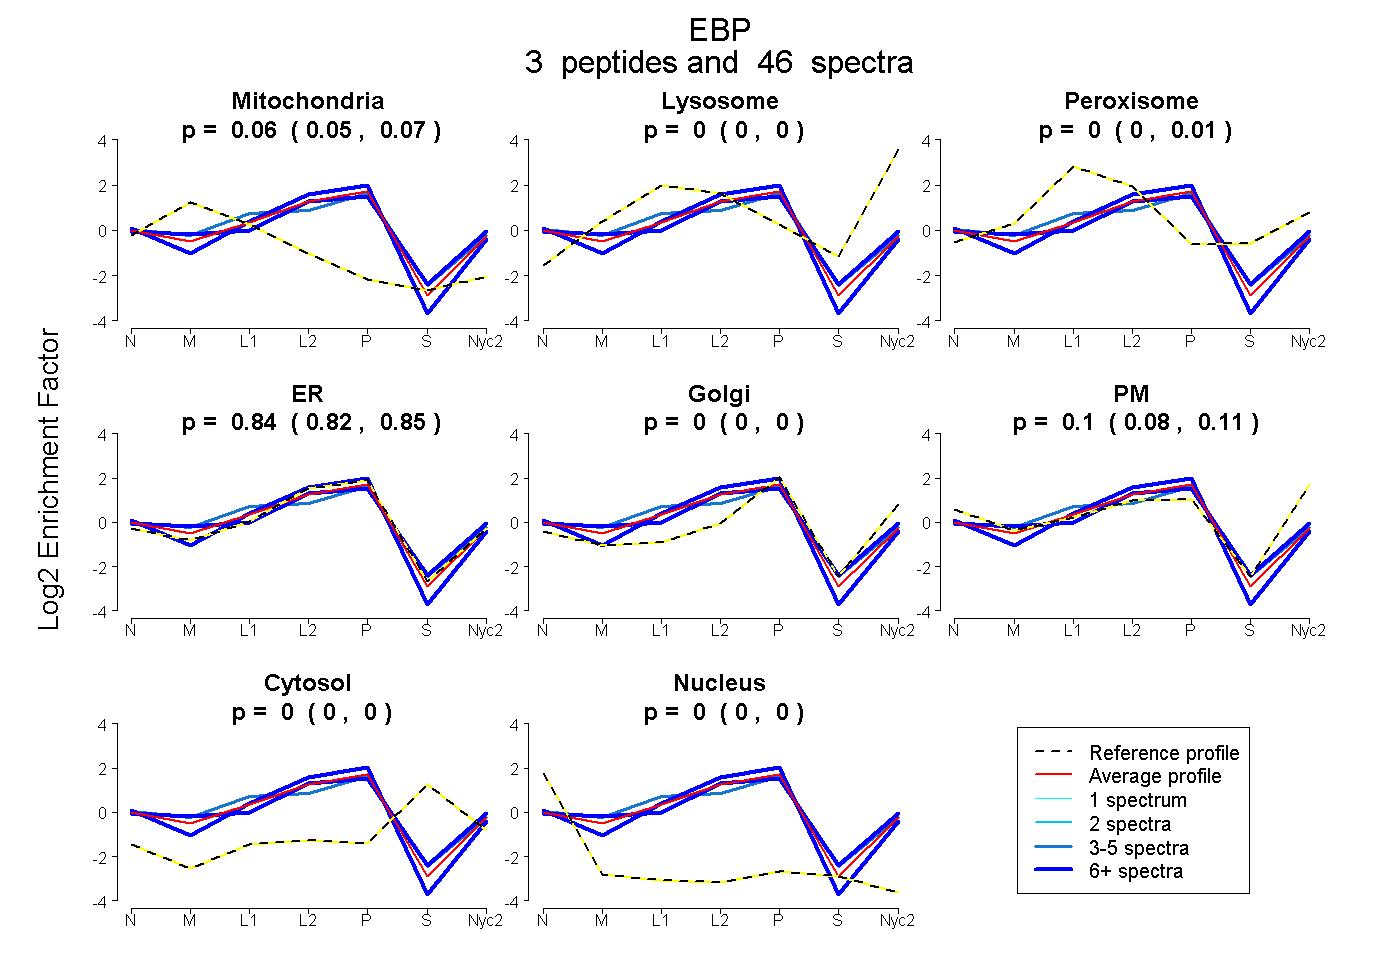
0.053 | 0.071
0.000 | 0.000
0.000 | 0.007
0.818 | 0.854
0.000 | 0.000
0.083 | 0.112
0.000 | 0.000
0.000 | 0.000
2peptides
spectra
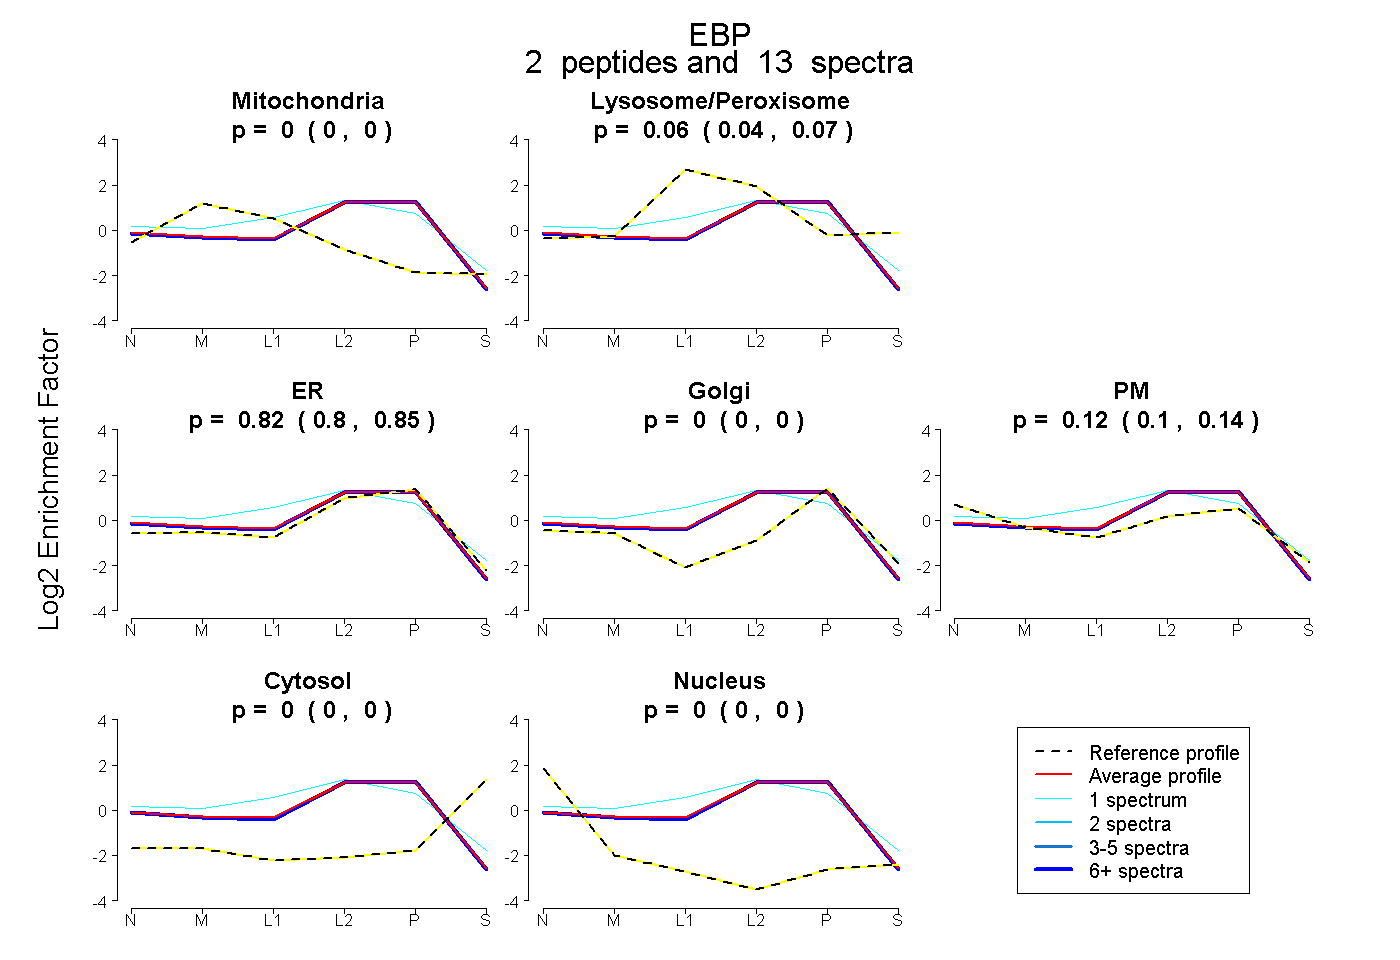
0.000 | 0.000
0.044 | 0.072
0.796 | 0.846
0.000 | 0.000
0.099 | 0.136
0.000 | 0.000
0.000 | 0.000
3peptides
spectra
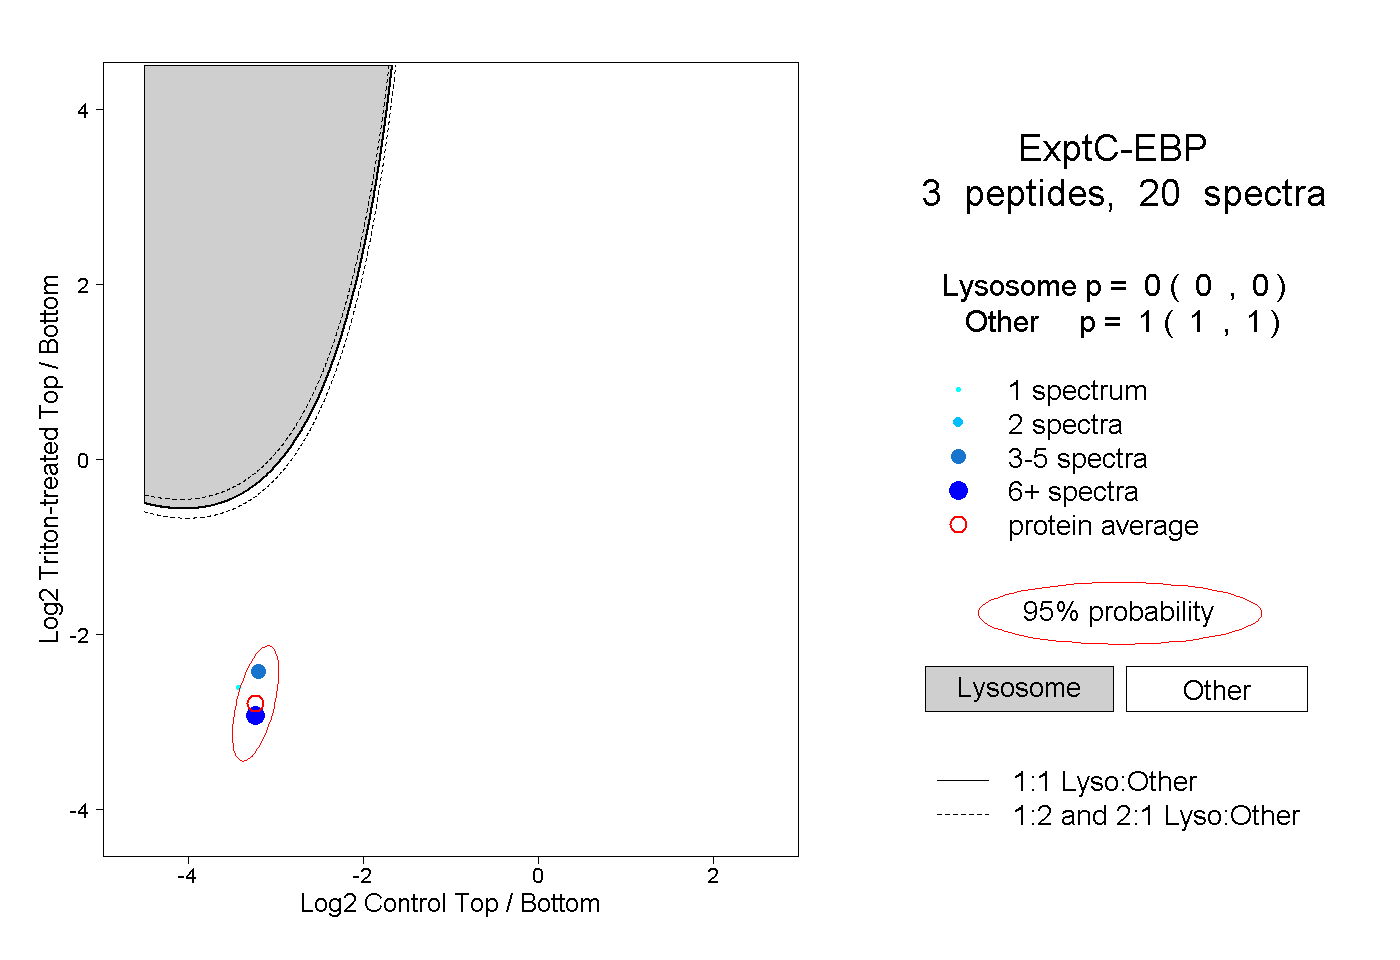
0.000 | 0.000
1.000 | 1.000
1peptide
spectrum
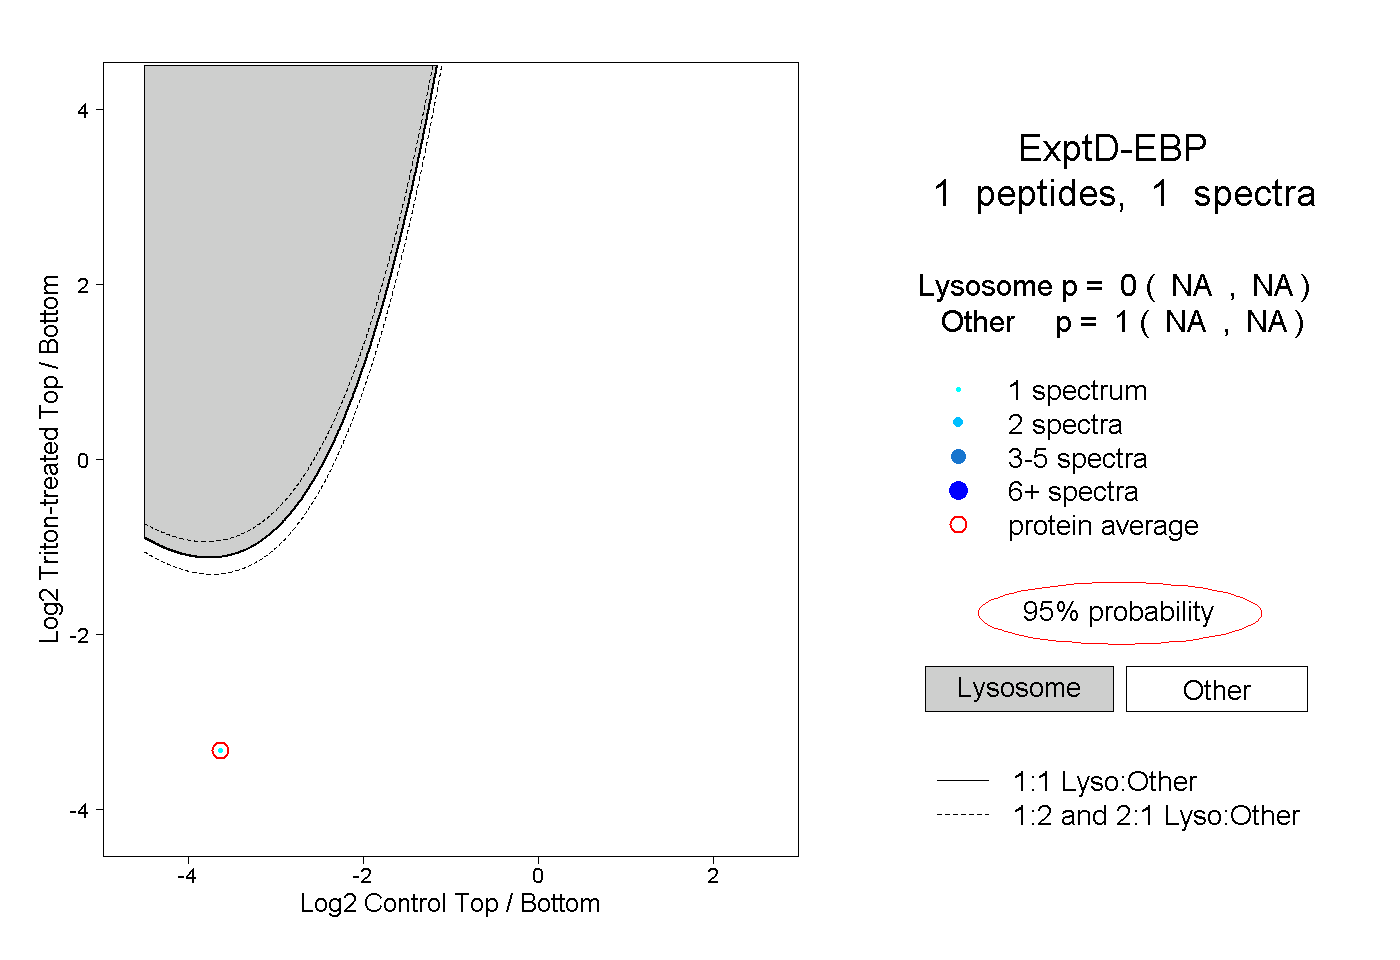
NA | NA
NA | NA