 5
5peptides
spectra

0.000 | 0.000
0.000 | 0.059
0.000 | 0.000
0.000 | 0.000
0.000 | 0.000
0.000 | 0.071
0.346 | 0.385
0.543 | 0.599
1peptide
spectrum
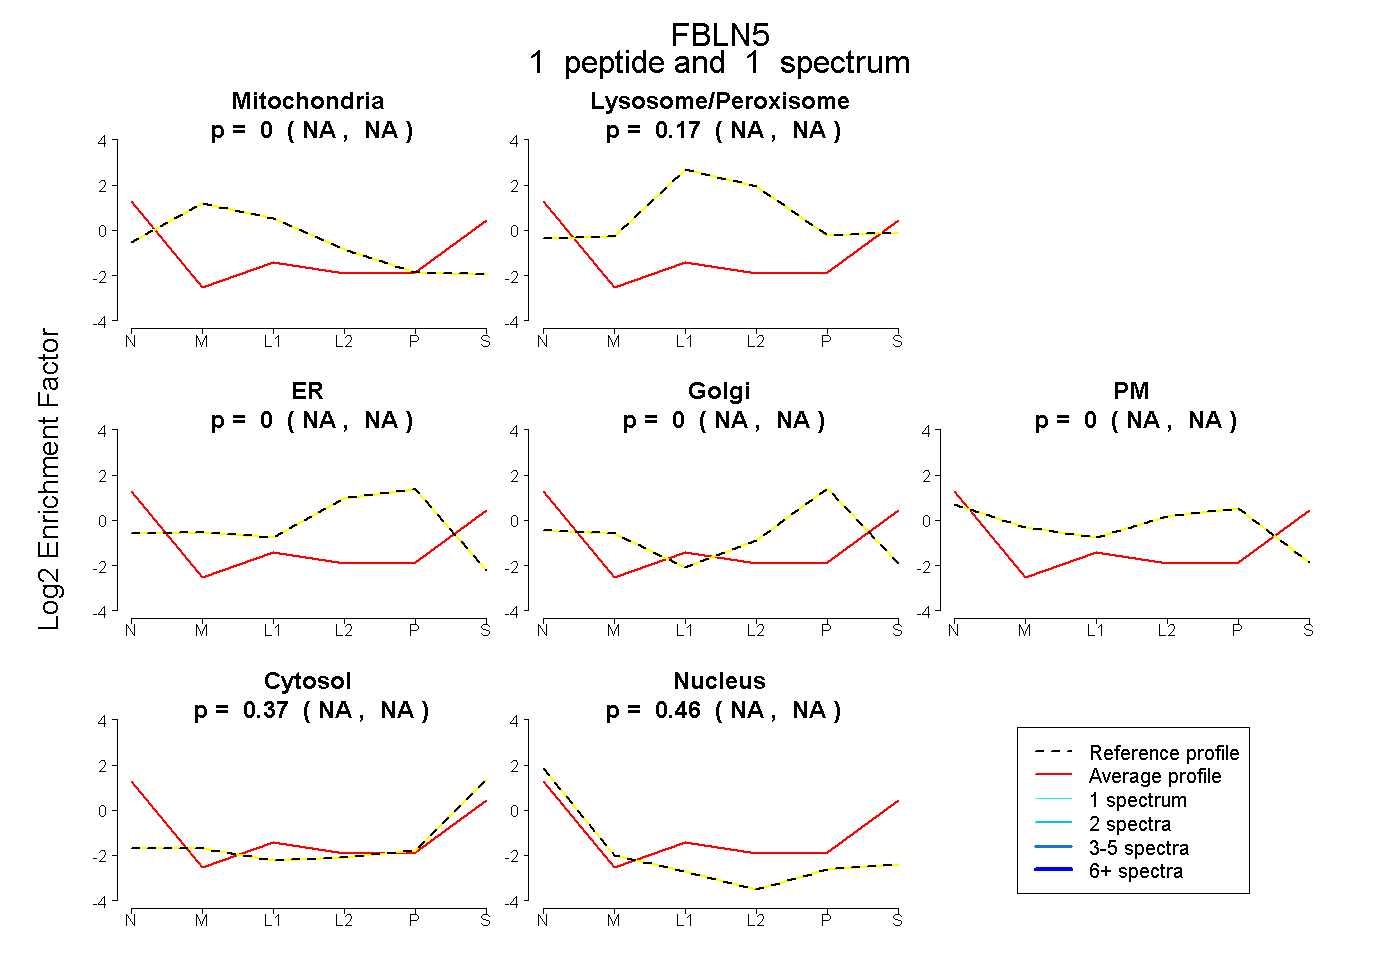
NA | NA
NA | NA
NA | NA
NA | NA
NA | NA
NA | NA
NA | NA
2peptides
spectra
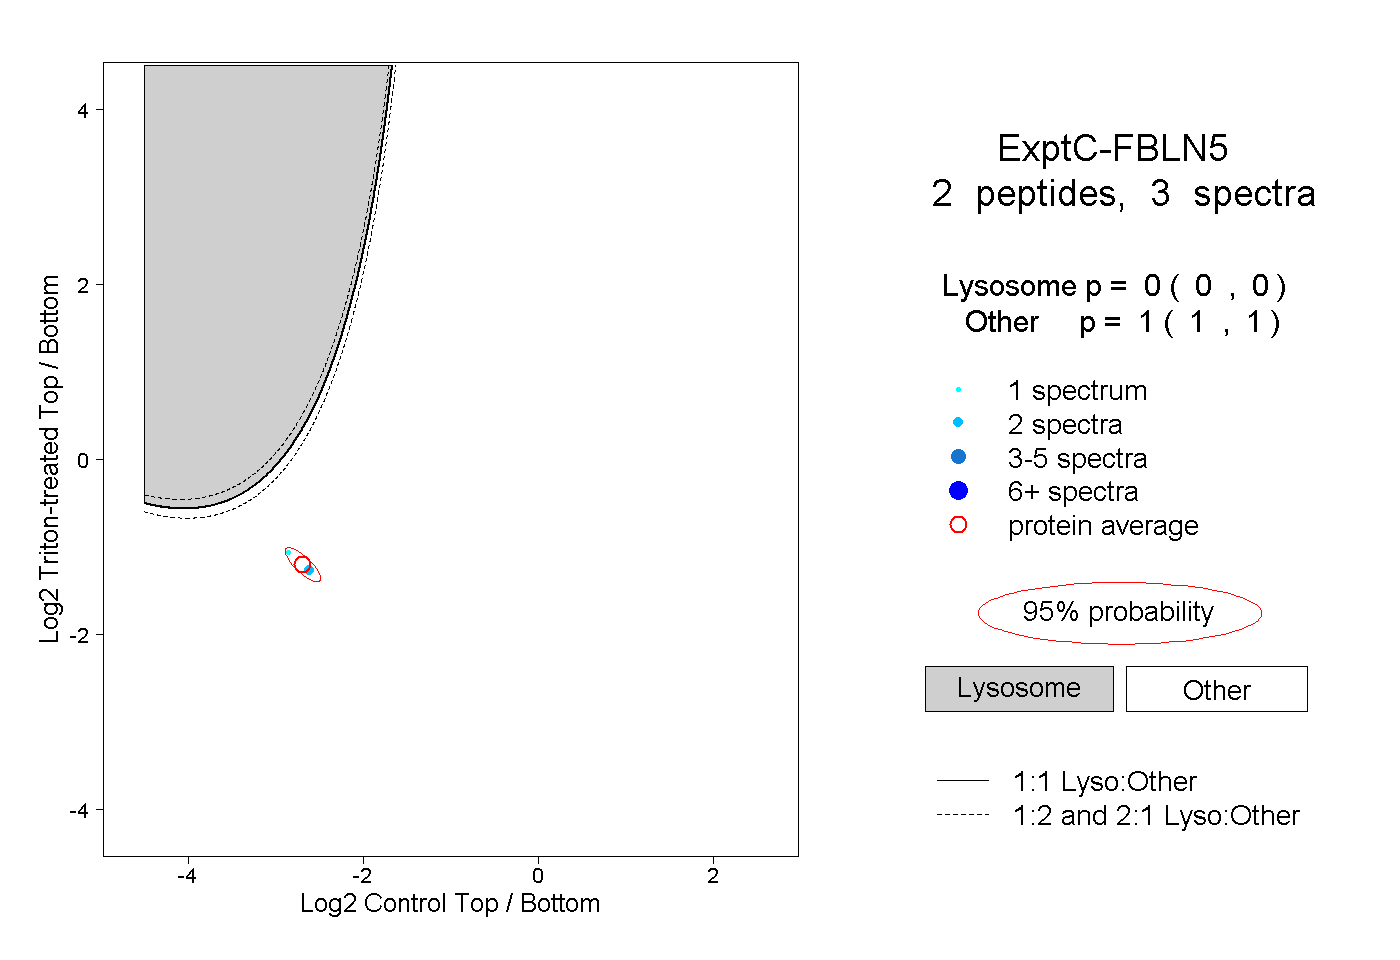
0.000 | 0.000
1.000 | 1.000