 5
5peptides
spectra

0.000 | 0.000
0.000 | 0.059
0.000 | 0.000
0.000 | 0.000
0.000 | 0.000
0.000 | 0.071
0.346 | 0.385
0.543 | 0.599
| Plot | Mito | Lyso | Perox | ER | Golgi | PM | Cytosol | Nucleus | |||||
| Expt A |
5 peptides |
9 spectra |
|
0.000 0.000 | 0.000 |
0.050 0.000 | 0.059 |
0.000 0.000 | 0.000 |
0.000 0.000 | 0.000 |
0.000 0.000 | 0.000 |
0.000 0.000 | 0.071 |
0.363 0.346 | 0.385 |
0.587 0.543 | 0.599 |
| 4 spectra, DMDVVSGR | 0.000 | 0.000 | 0.000 | 0.000 | 0.000 | 0.158 | 0.396 | 0.445 | ||
| 2 spectra, YPGAYYIFQIK | 0.000 | 0.000 | 0.000 | 0.000 | 0.000 | 0.000 | 0.345 | 0.655 | ||
| 1 spectrum, DQPFTILFR | 0.000 | 0.046 | 0.000 | 0.000 | 0.000 | 0.000 | 0.264 | 0.690 | ||
| 1 spectrum, SCQDINECEHR | 0.000 | 0.000 | 0.000 | 0.000 | 0.000 | 0.186 | 0.371 | 0.443 | ||
| 1 spectrum, QTGPISATLVMTRPIK | 0.000 | 0.000 | 0.000 | 0.000 | 0.000 | 0.000 | 0.338 | 0.662 |
| Plot | Mito | Lyso or Perox | ER | Golgi | PM | Cytosol | Nucleus | ||||||
| Expt B |
1 peptide |
1 spectrum |
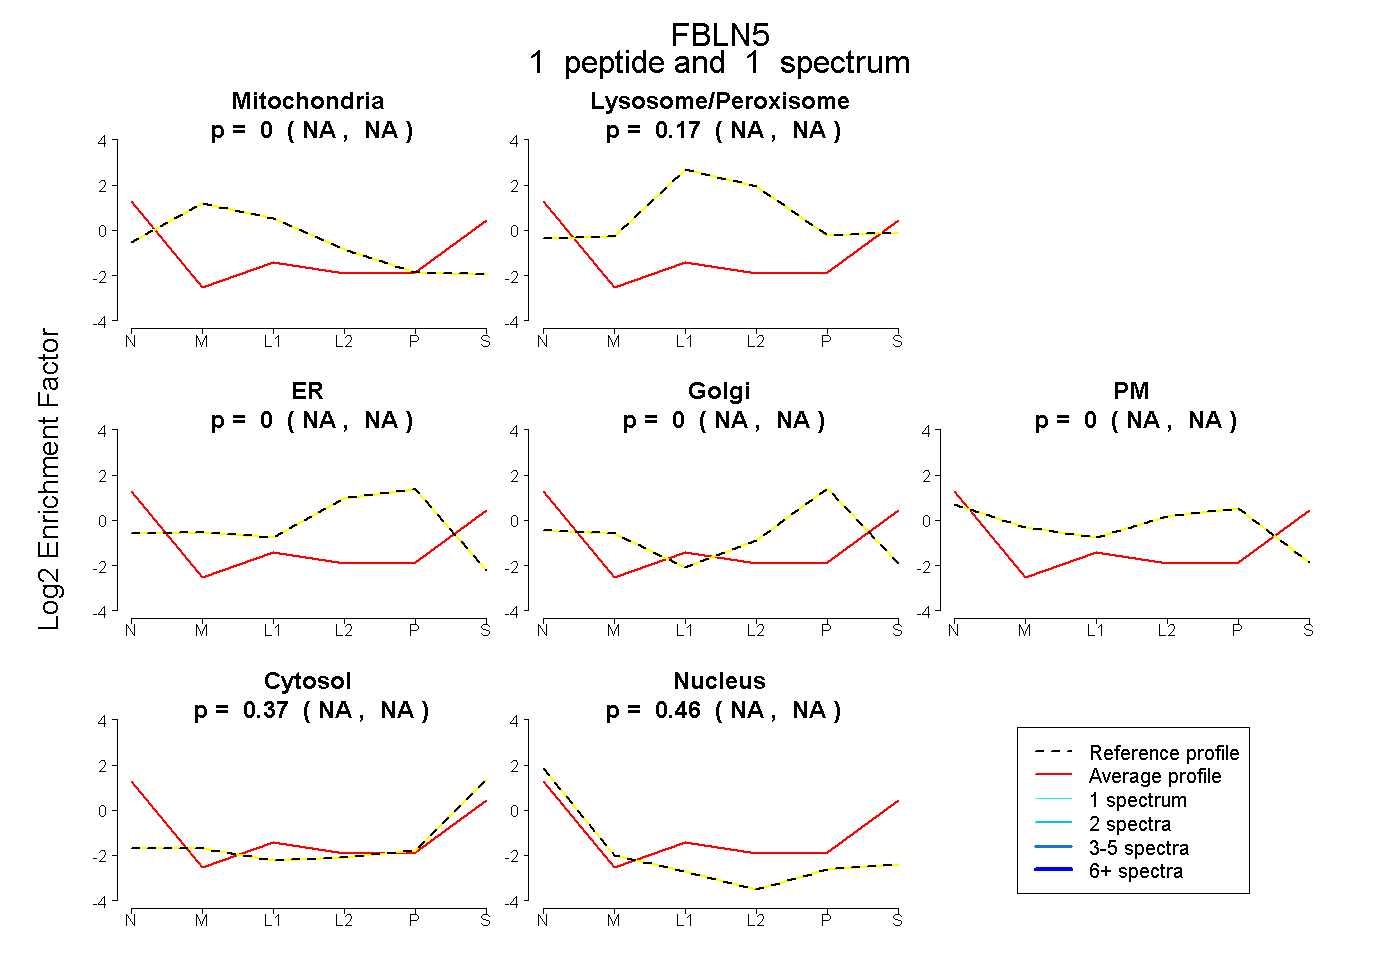 |
0.000 NA | NA |
0.171 NA | NA |
0.000 NA | NA |
0.000 NA | NA |
0.000 NA | NA |
0.367 NA | NA |
0.461 NA | NA |
|||
| Plot | Lyso | Other | |||||||||||
| Expt C |
2 peptides |
3 spectra |
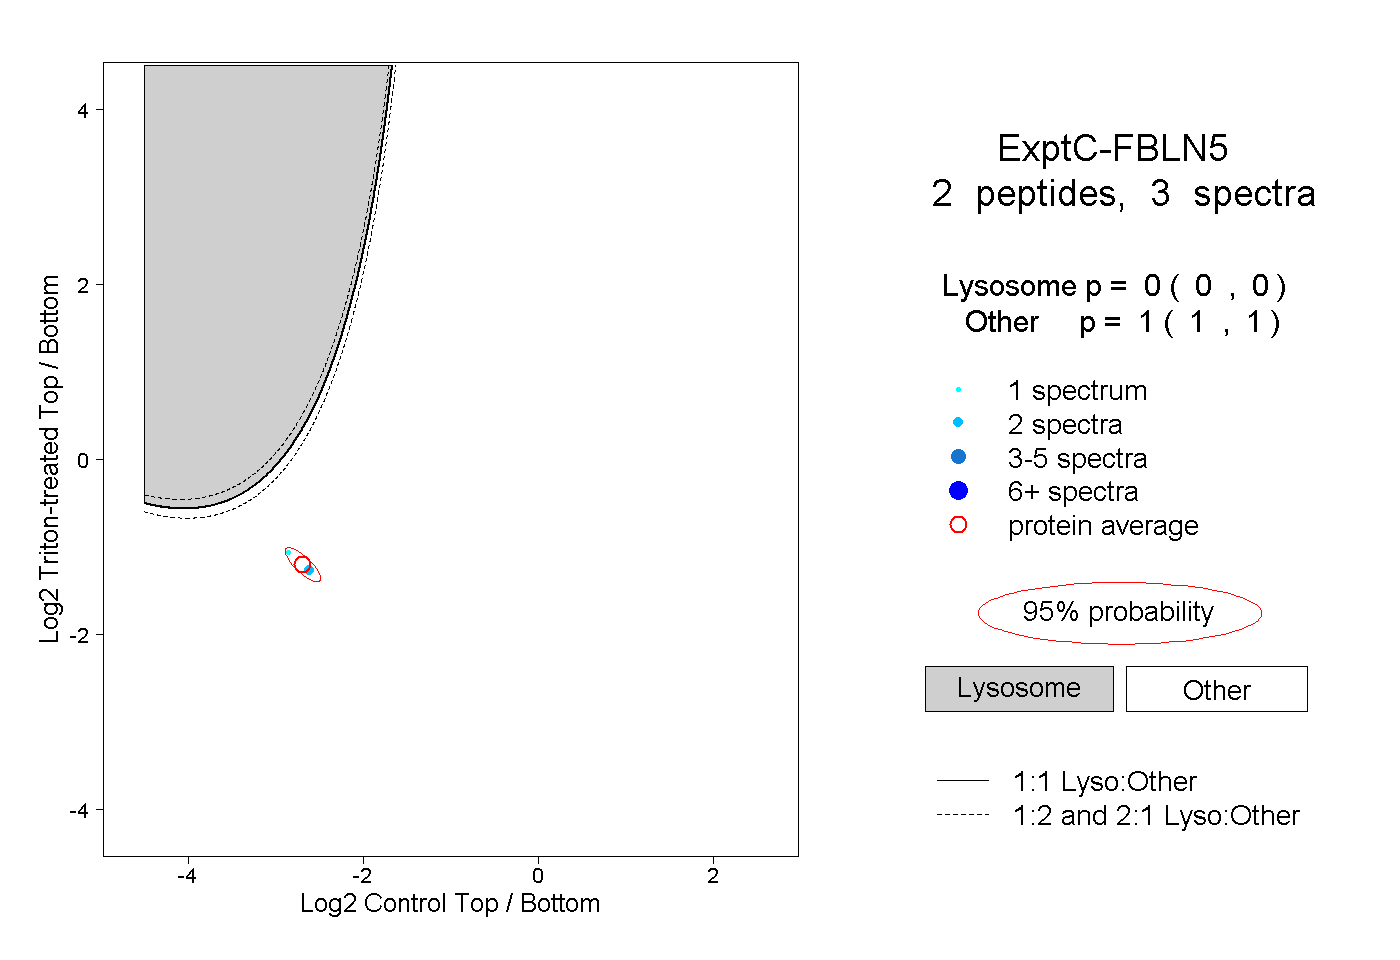 |
0.000 0.000 | 0.000 |
1.000 1.000 | 1.000 |