24
24peptides
spectra
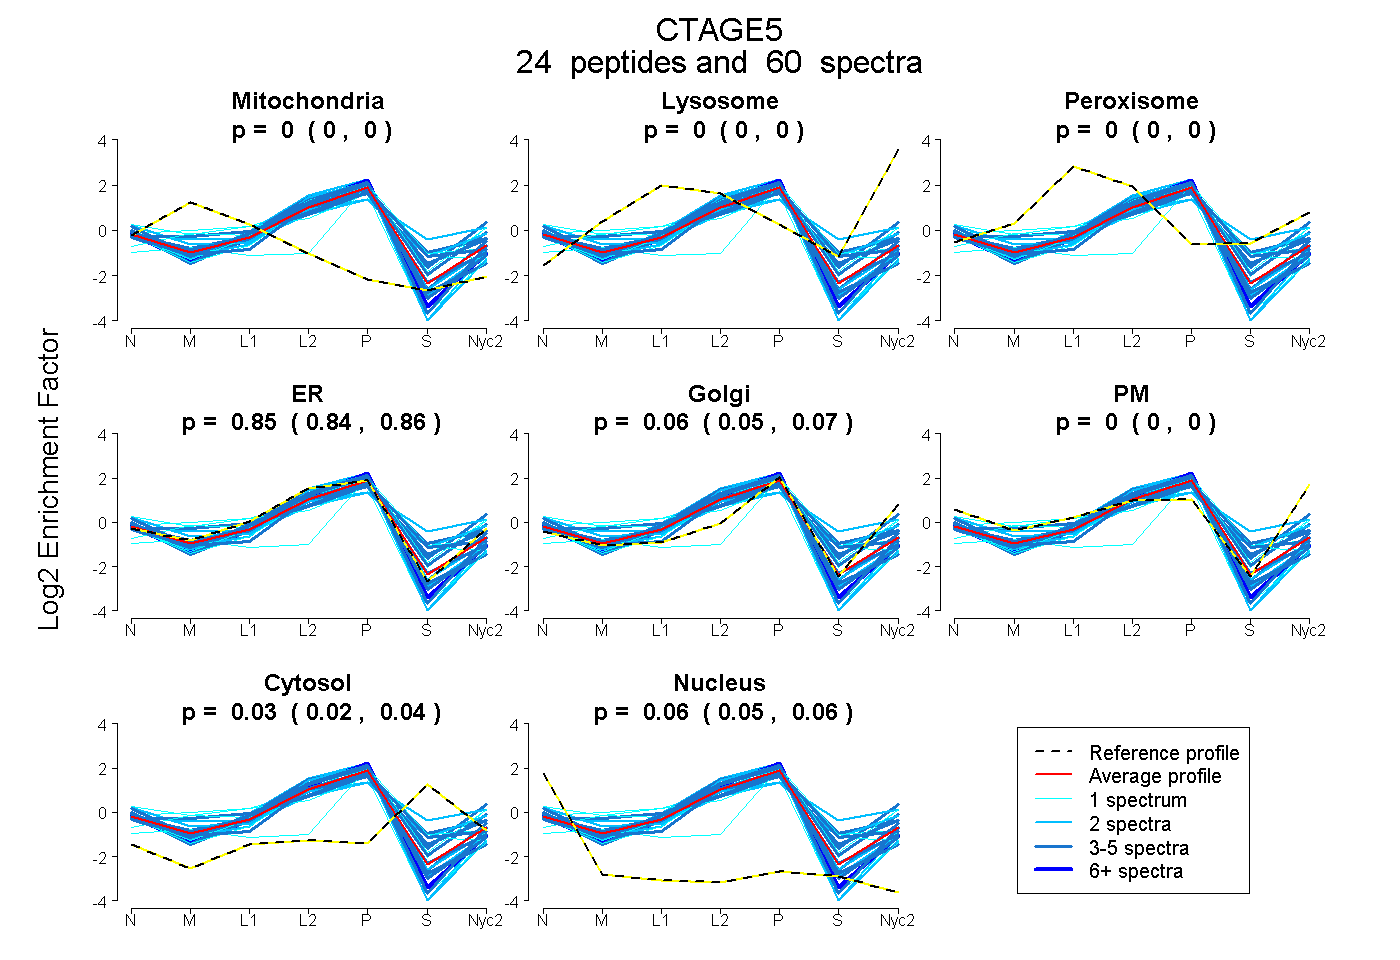
0.000 | 0.000
0.000 | 0.000
0.000 | 0.000
0.839 | 0.859
0.050 | 0.073
0.000 | 0.000
0.021 | 0.039
0.051 | 0.061
14peptides
spectra
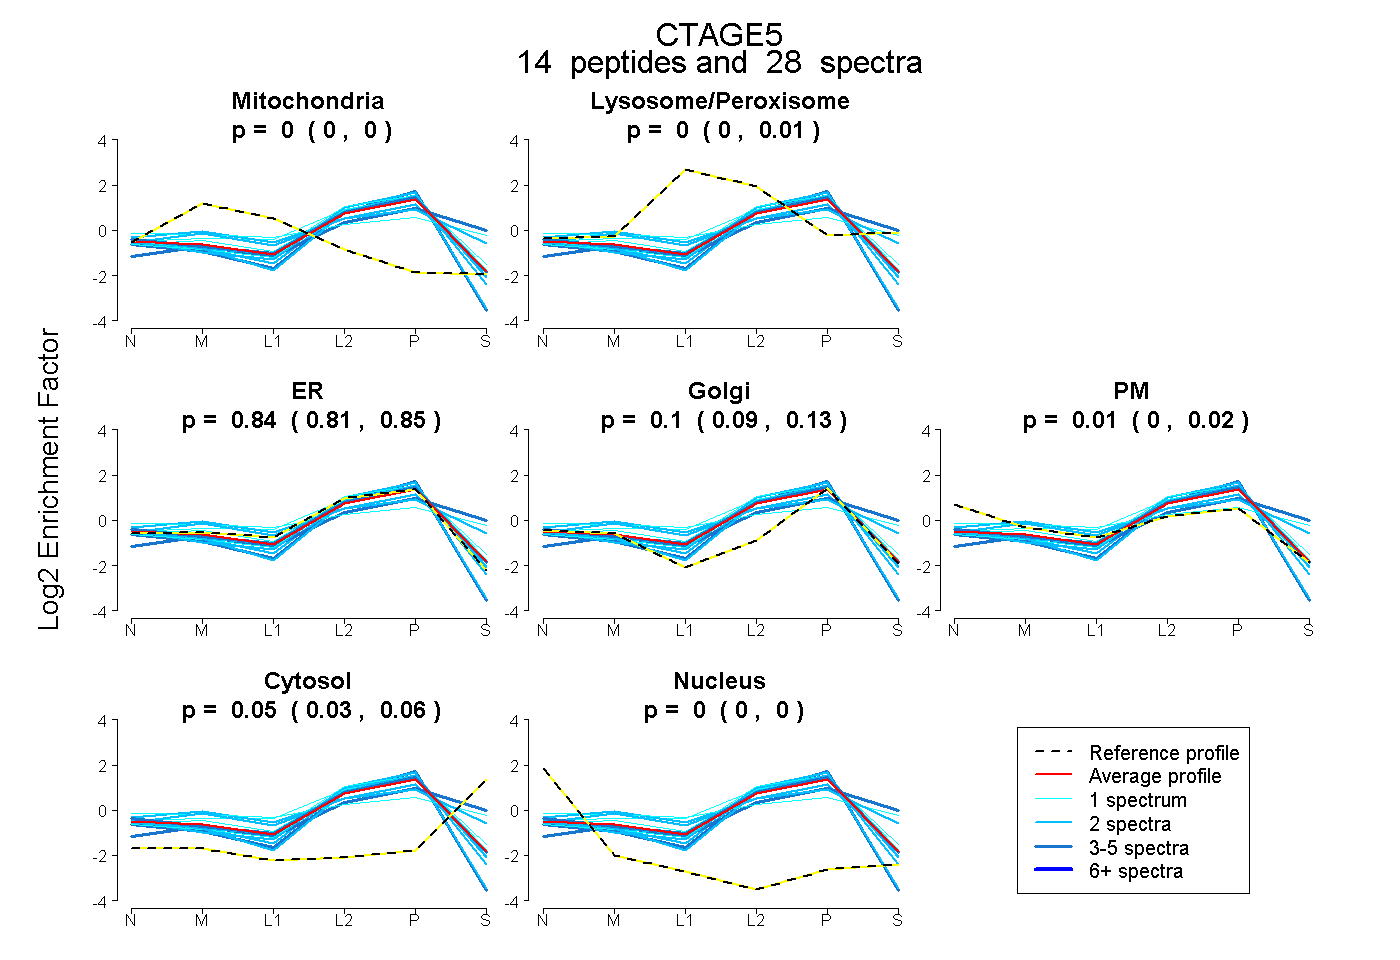
0.000 | 0.000
0.000 | 0.013
0.809 | 0.850
0.088 | 0.128
0.000 | 0.018
0.034 | 0.059
0.000 | 0.000