 3
3peptides
spectra
0.000 | 0.101
0.000 | 0.003
0.000 | 0.187
0.121 | 0.459
0.000 | 0.128
0.330 | 0.728
0.000 | 0.000
0.000 | 0.024
1peptide
spectra
0.000 | 0.000
1.000 | 1.000
| Plot | Mito | Lyso | Perox | ER | Golgi | PM | Cytosol | Nucleus | |||||
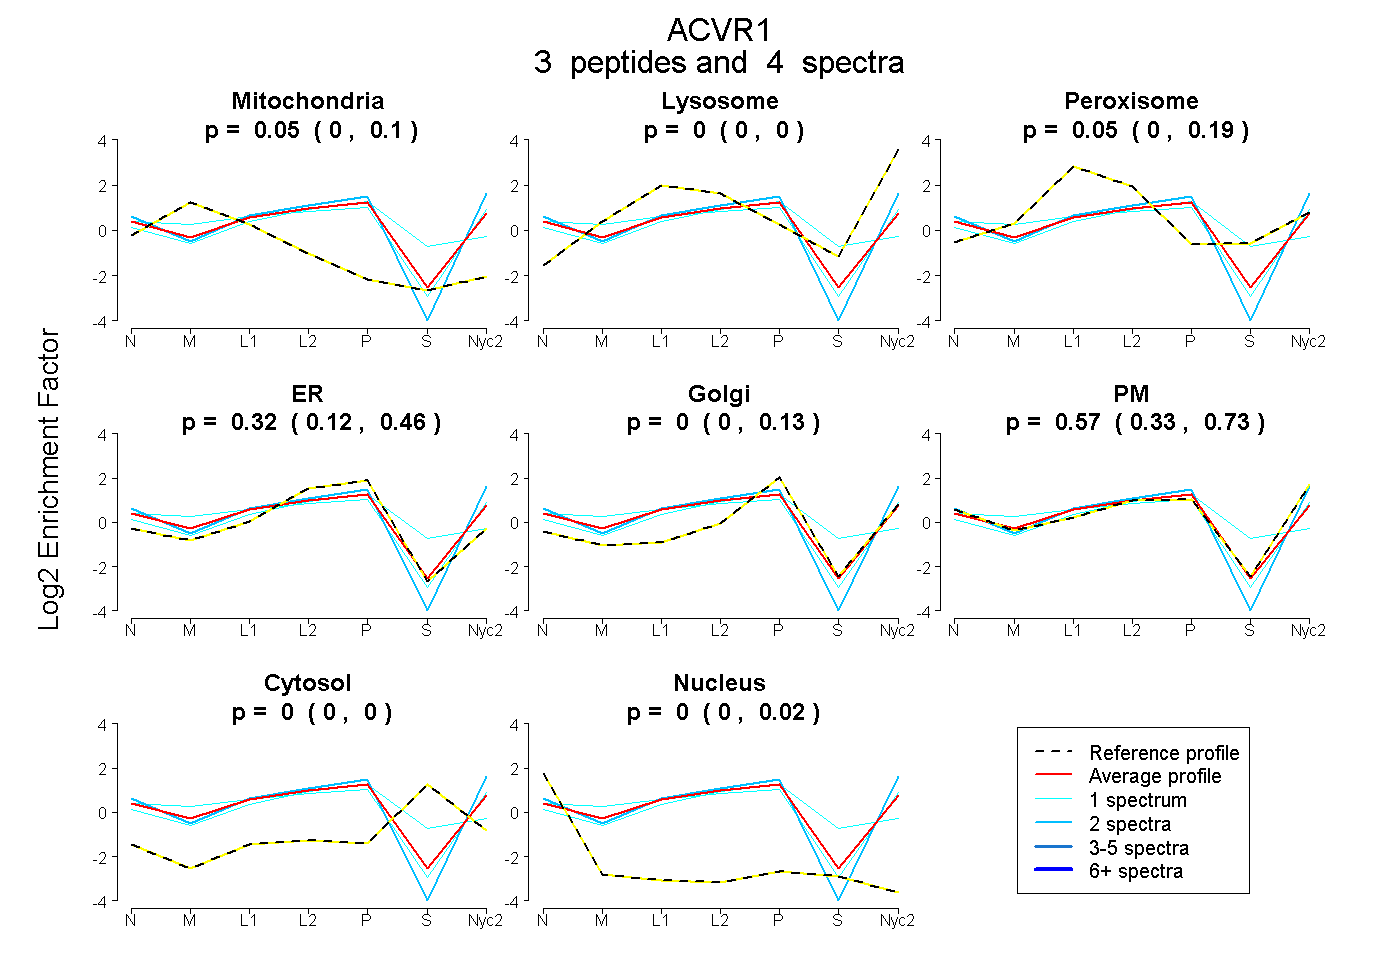
| Expt A |
3 peptides |
4 spectra |
|
0.053 0.000 | 0.101 |
0.000 0.000 | 0.003 |
0.052 0.000 | 0.187 |
0.320 0.121 | 0.459 |
0.000 0.000 | 0.128 |
0.575 0.330 | 0.728 |
0.000 0.000 | 0.000 |
0.000 0.000 | 0.024 |
||
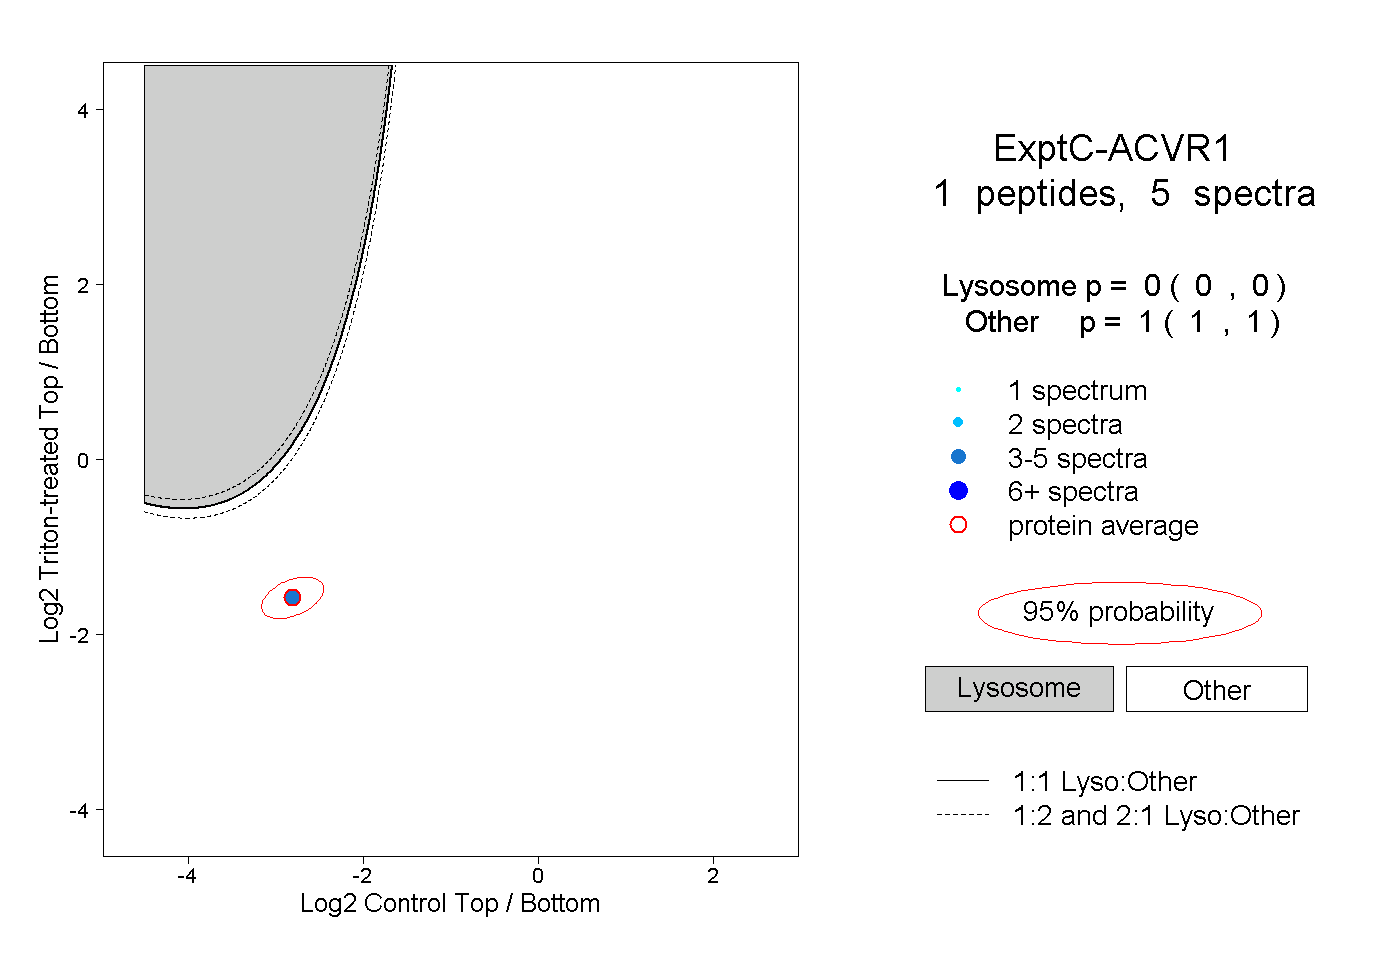
| Plot | Lyso | Other | |||||||||||
| Expt C |
1 peptide |
5 spectra |
|
0.000 0.000 | 0.000 |
1.000 1.000 | 1.000 |