 2
2peptides
spectra
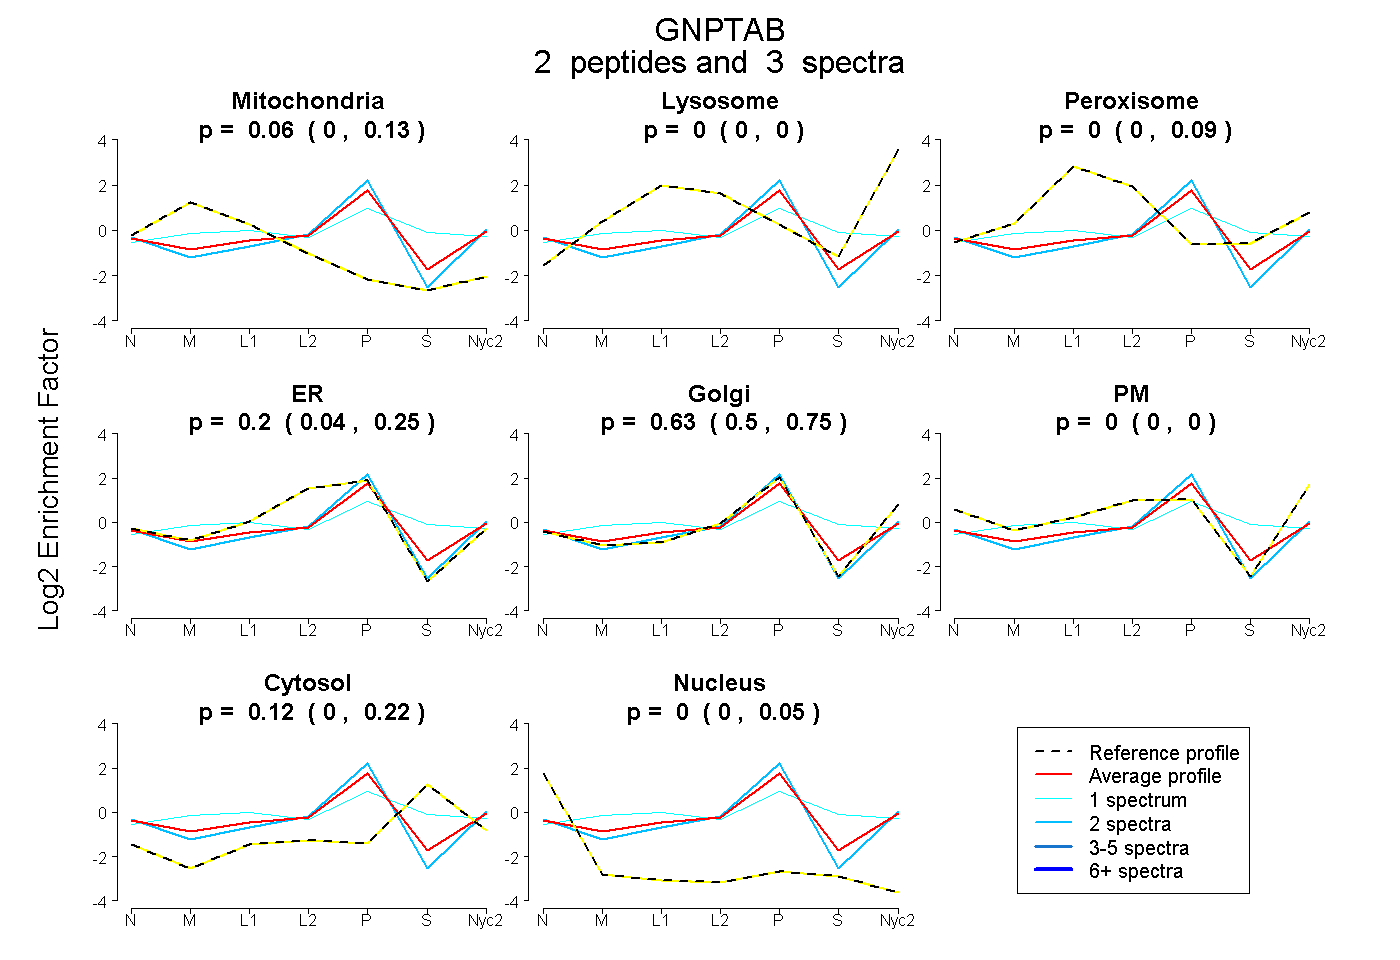
0.000 | 0.131
0.000 | 0.000
0.000 | 0.090
0.043 | 0.252
0.504 | 0.752
0.000 | 0.000
0.000 | 0.220
0.000 | 0.046
| Plot | Mito | Lyso | Perox | ER | Golgi | PM | Cytosol | Nucleus | |||||
| Expt A |
2 peptides |
3 spectra |
|
0.058 0.000 | 0.131 |
0.000 0.000 | 0.000 |
0.000 0.000 | 0.090 |
0.195 0.043 | 0.252 |
0.626 0.504 | 0.752 |
0.000 0.000 | 0.000 |
0.120 0.000 | 0.220 |
0.000 0.000 | 0.046 |
| 2 spectra, FEDNEELR | 0.000 | 0.000 | 0.000 | 0.176 | 0.767 | 0.000 | 0.000 | 0.056 | ||
| 1 spectrum, YVAGGGGTGNIGVGQR | 0.065 | 0.000 | 0.249 | 0.000 | 0.407 | 0.000 | 0.278 | 0.000 |
| Plot | Lyso | Other | |||||||||||
| Expt C |
2 peptides |
5 spectra |
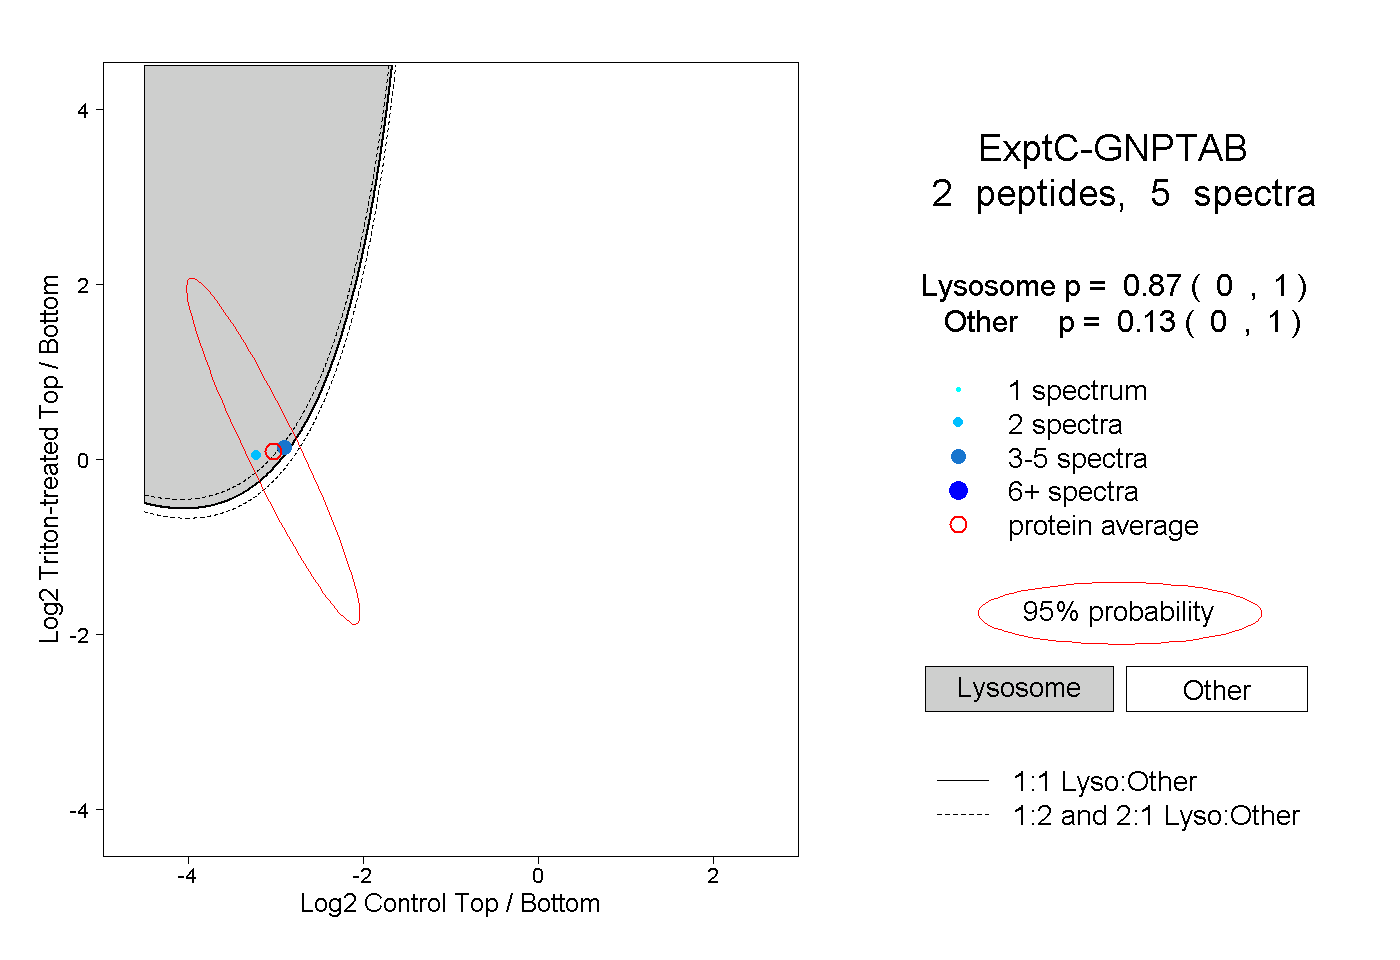 |
0.870 0.000 | 1.000 |
0.130 0.000 | 1.000 |