20
20peptides
spectra
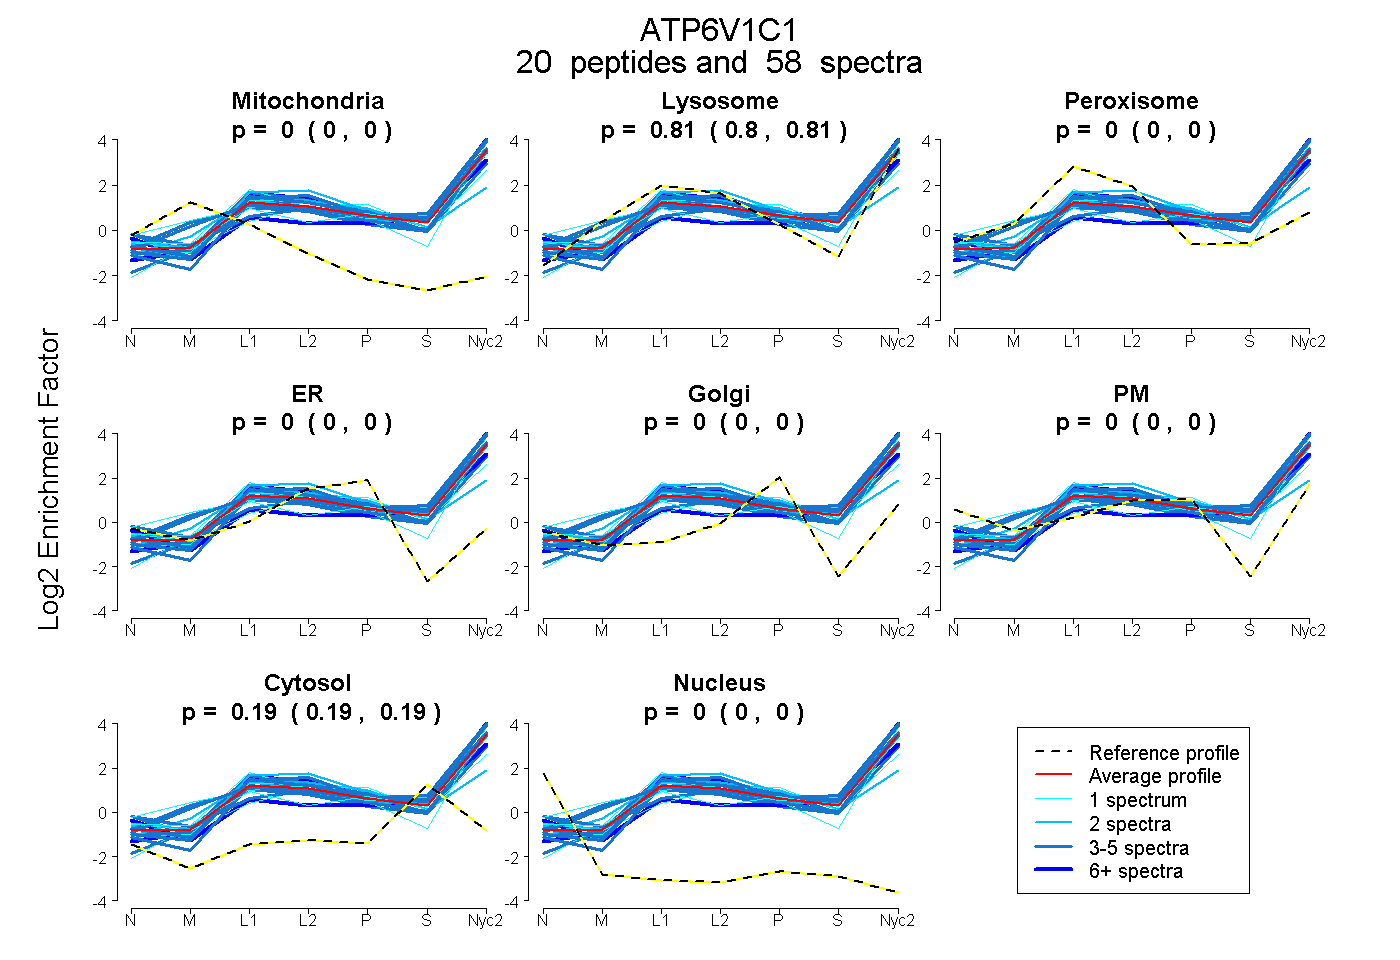
0.000 | 0.000
0.805 | 0.812
0.000 | 0.000
0.000 | 0.000
0.000 | 0.000
0.000 | 0.000
0.188 | 0.194
0.000 | 0.000
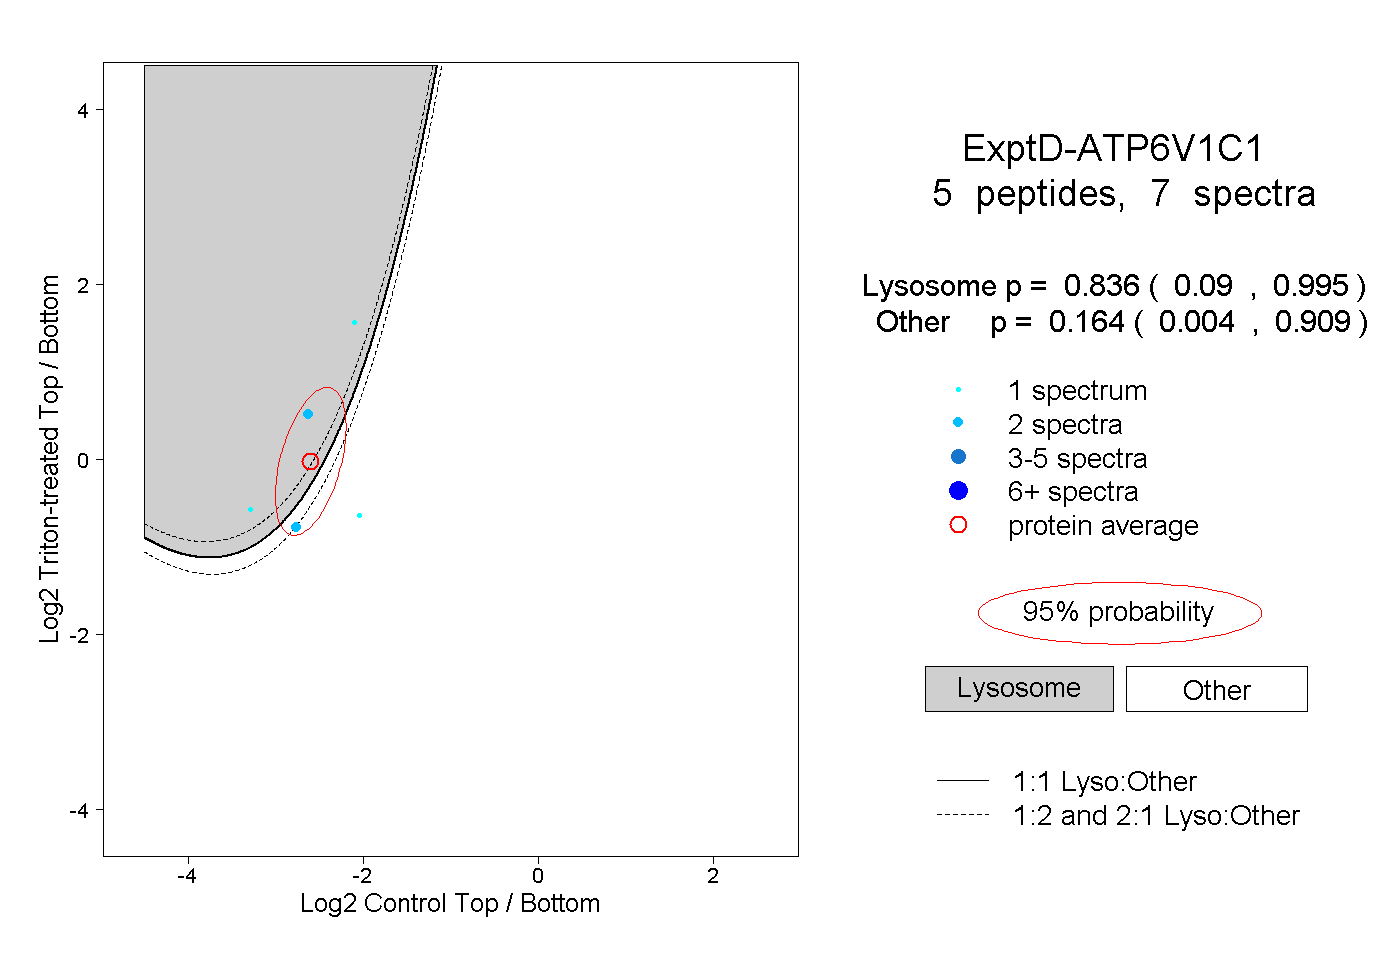
5peptides
spectra
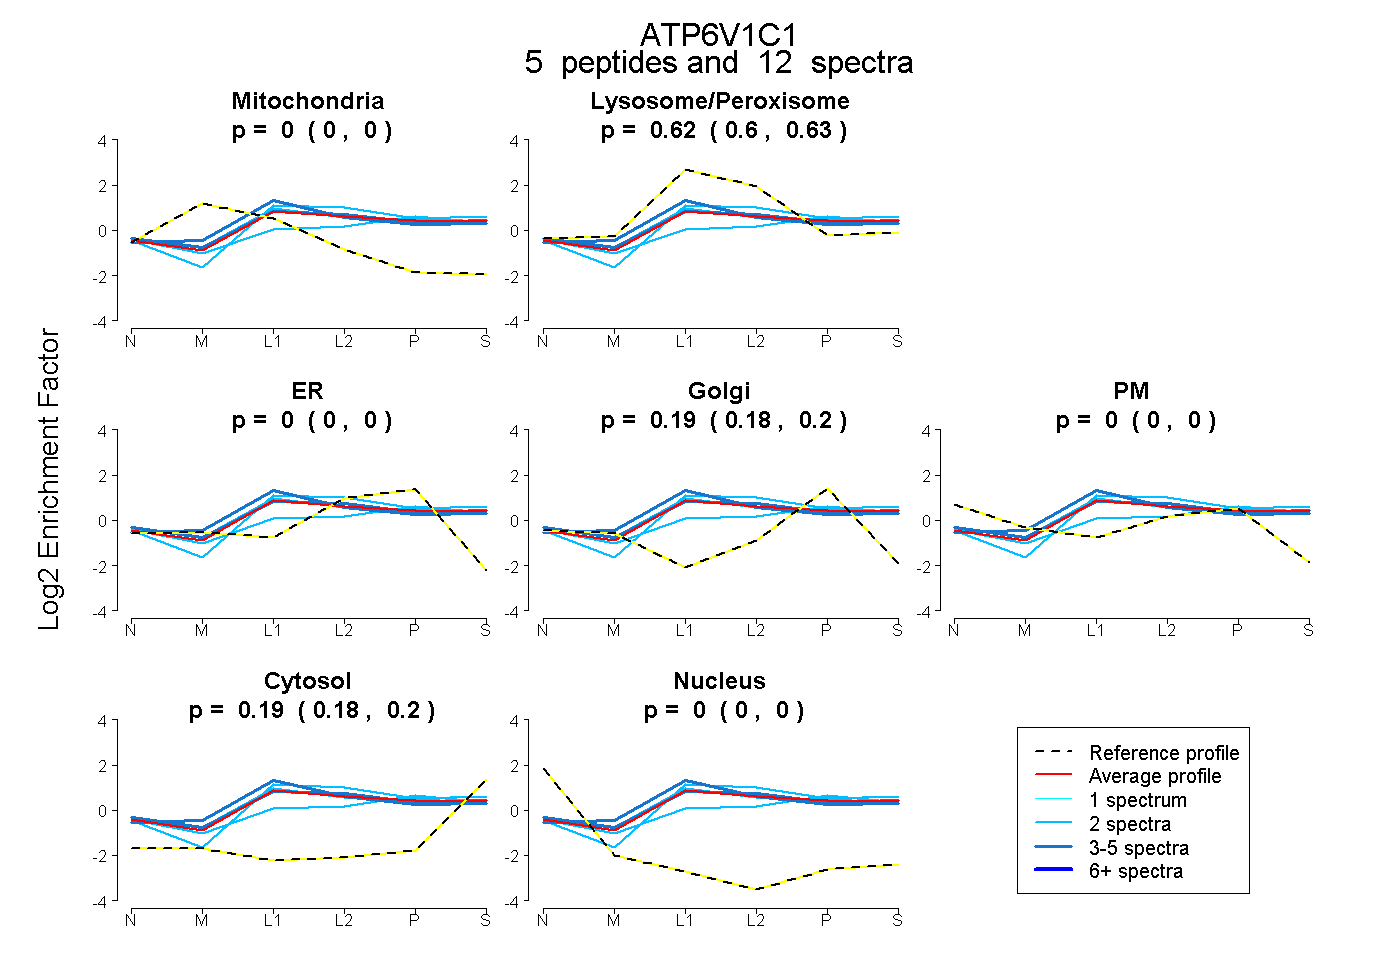
0.000 | 0.000
0.598 | 0.630
0.000 | 0.000
0.179 | 0.204
0.000 | 0.000
0.182 | 0.202
0.000 | 0.000
22peptides
spectra
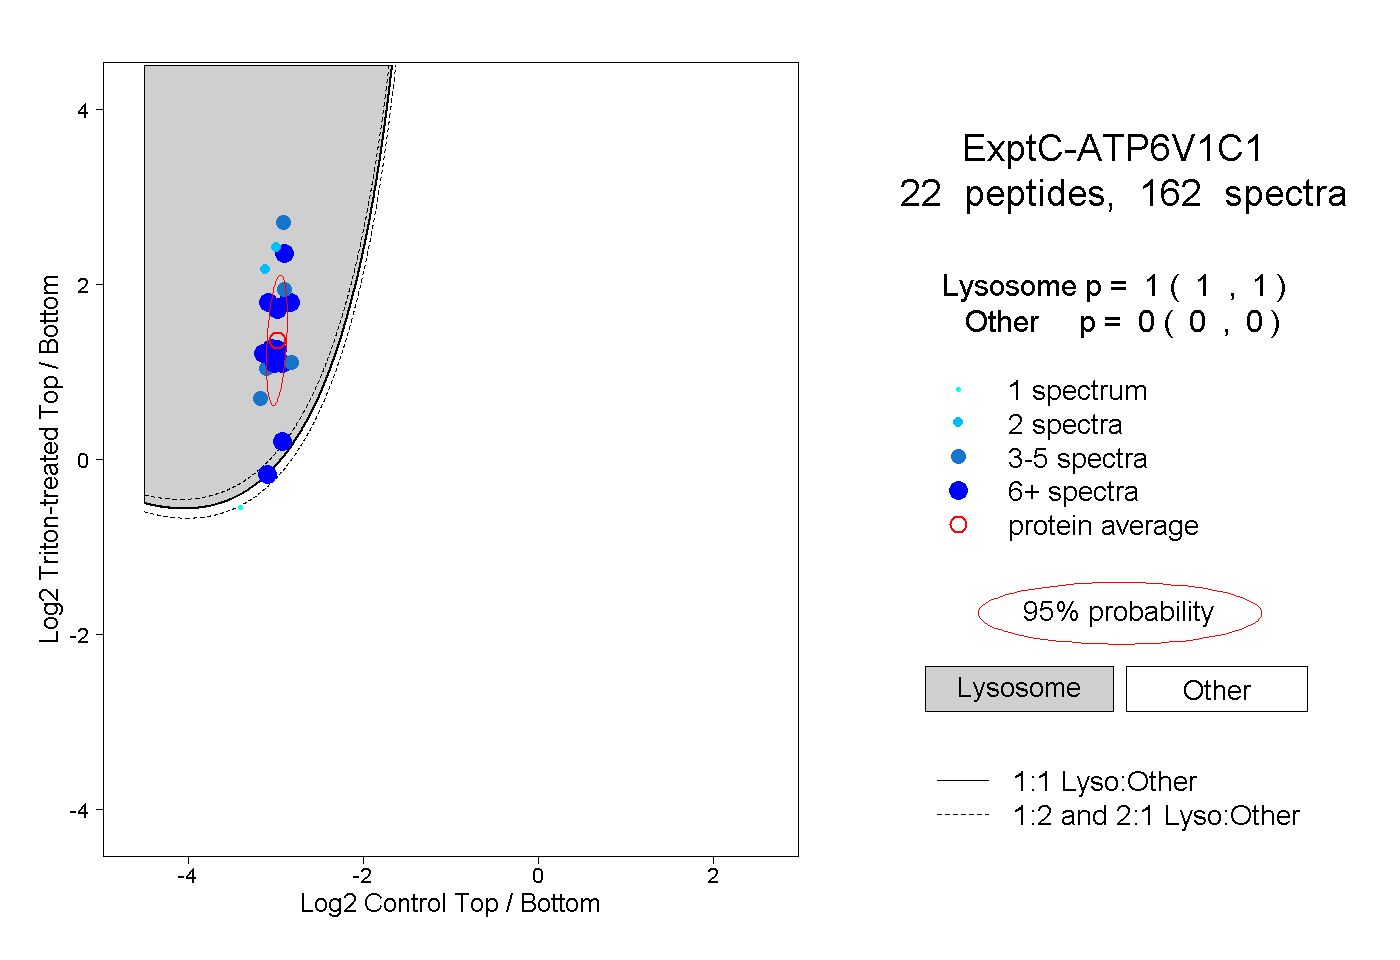
1.000 | 1.000
0.000 | 0.000