ATP6V1C1
[ENSRNOP00000006917]
Main page
| | | Plot |
Mito |
Lyso |
|
Perox |
ER |
Golgi |
PM |
Cytosol |
Nucleus |
|
| Expt A |
 20
20
peptides |
58
spectra |
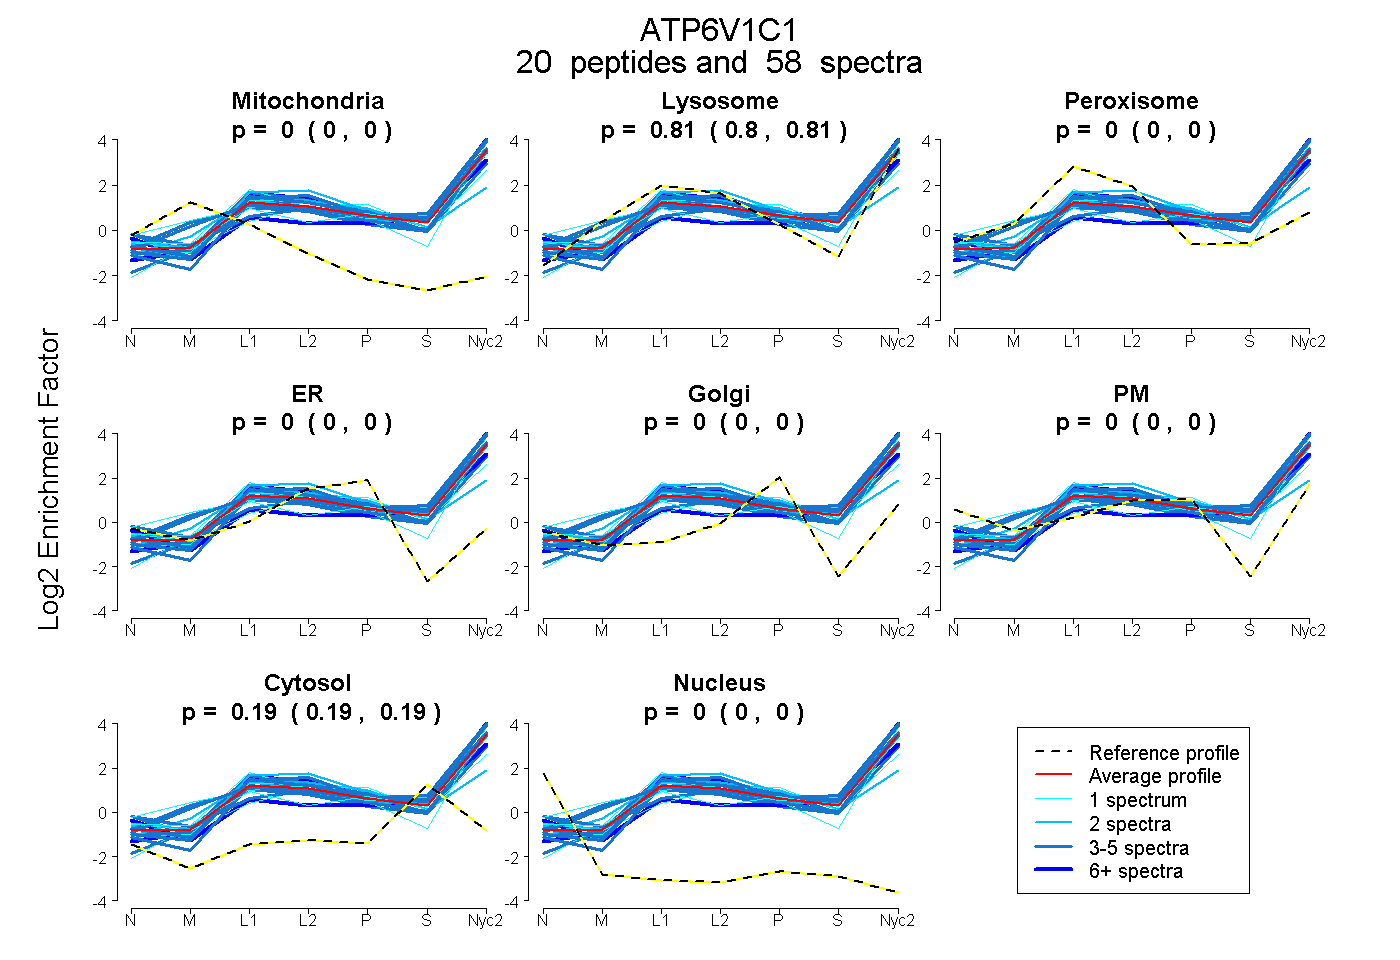 |
0.000
0.000 | 0.000 |
0.809
0.805 | 0.812 |
|
0.000
0.000 | 0.000 |
0.000
0.000 | 0.000 |
0.000
0.000 | 0.000 |
0.000
0.000 | 0.000 |
0.191
0.188 | 0.194 |
0.000
0.000 | 0.000 |
|
| | | Plot |
Mito |
|
Lyso or Perox |
|
ER |
Golgi |
PM |
Cytosol |
Nucleus |
|
| Expt B |
5
peptides |
12
spectra |
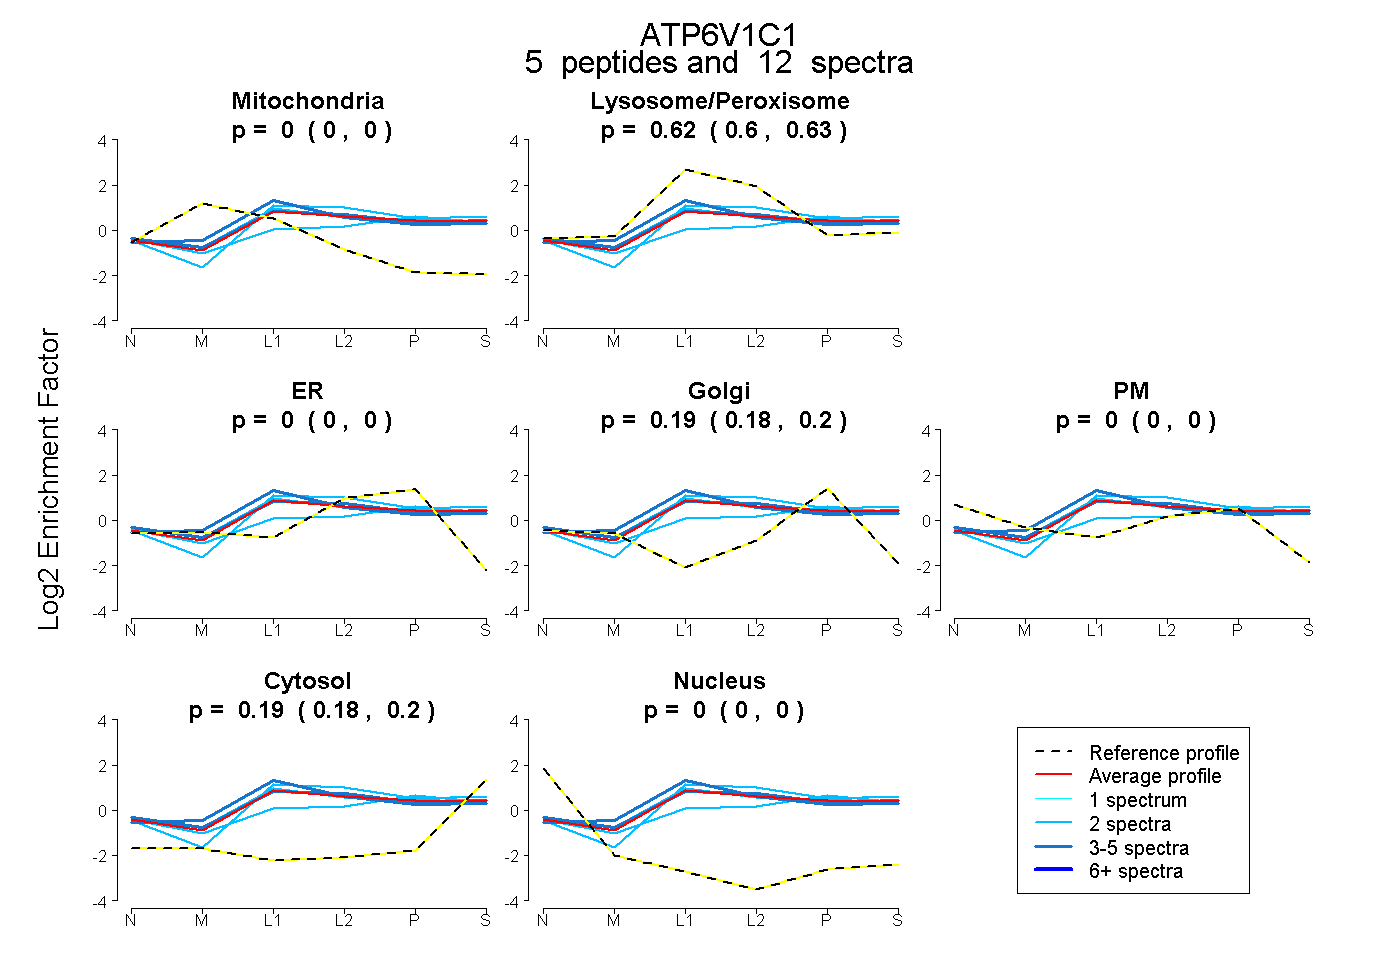 |
0.000
0.000 | 0.000 |
|
0.615
0.598 | 0.630 |
|
0.000
0.000 | 0.000 |
0.193
0.179 | 0.204 |
0.000
0.000 | 0.000 |
0.192
0.182 | 0.202 |
0.000
0.000 | 0.000 |
|
| 3 spectra, VFVESVLR |
0.000 |
|
0.627 |
|
0.000 |
0.186 |
0.000 |
0.187 |
0.000 |
|
| 3 spectra, LNHNDWIK |
0.000 |
|
0.681 |
|
0.000 |
0.151 |
0.000 |
0.168 |
0.000 |
|
| 2 spectra, GNLQNLER |
0.000 |
|
0.623 |
|
0.000 |
0.209 |
0.000 |
0.168 |
0.000 |
|
| 2 spectra, LDAFVEGVVK |
0.000 |
|
0.647 |
|
0.085 |
0.043 |
0.000 |
0.225 |
0.000 |
|
| 2 spectra, ASAYNNLK |
0.000 |
|
0.461 |
|
0.000 |
0.313 |
0.000 |
0.227 |
0.000 |
|
| | | Plot |
|
Lyso |
|
|
|
|
|
|
|
Other |
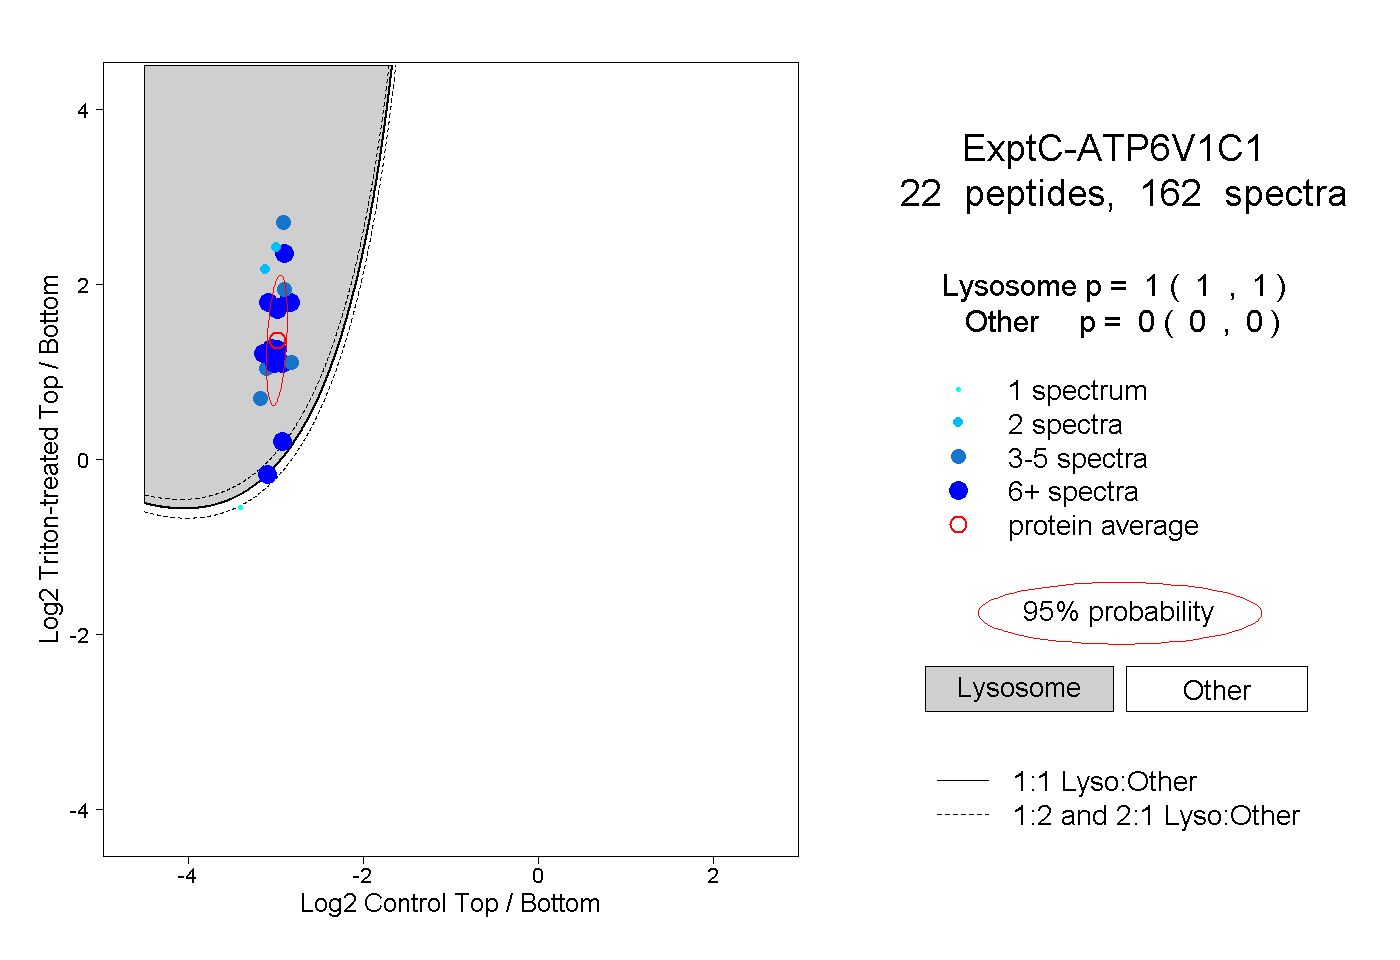
| Expt C |
22
peptides |
162
spectra |
 |
|
1.000
1.000 | 1.000 |
|
|
|
|
|
|
|
0.000
0.000 | 0.000 |
| | | Plot |
|
Lyso |
|
|
|
|
|
|
|
Other |
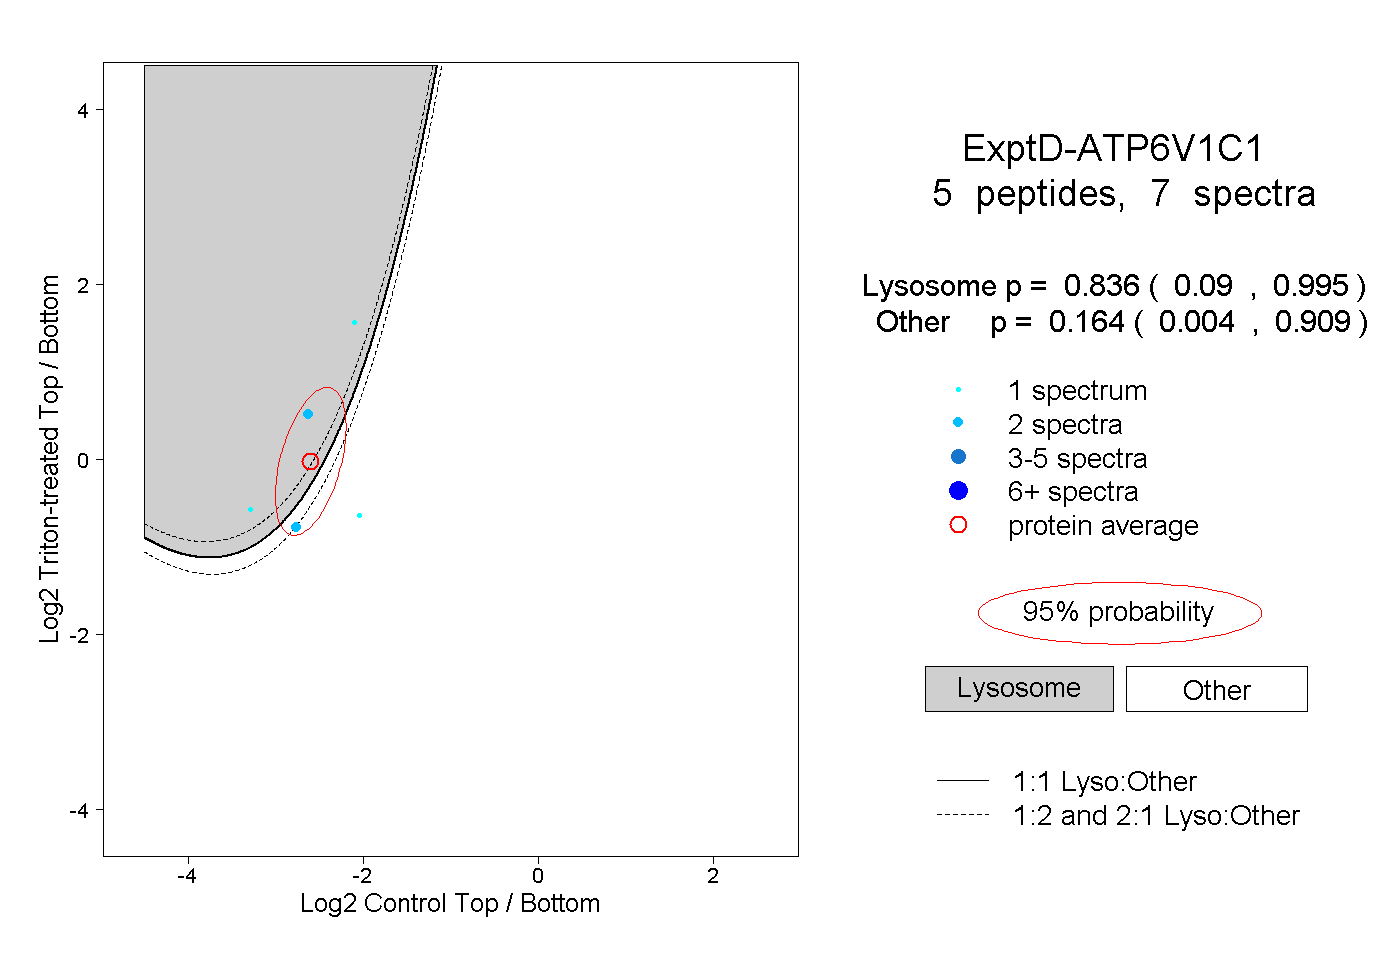
| Expt D |
5
peptides |
7
spectra |
 |
|
0.836
0.090 | 0.995 |
|
|
|
|
|
|
|
0.164
0.004 | 0.909 |