 5
5peptides
spectra
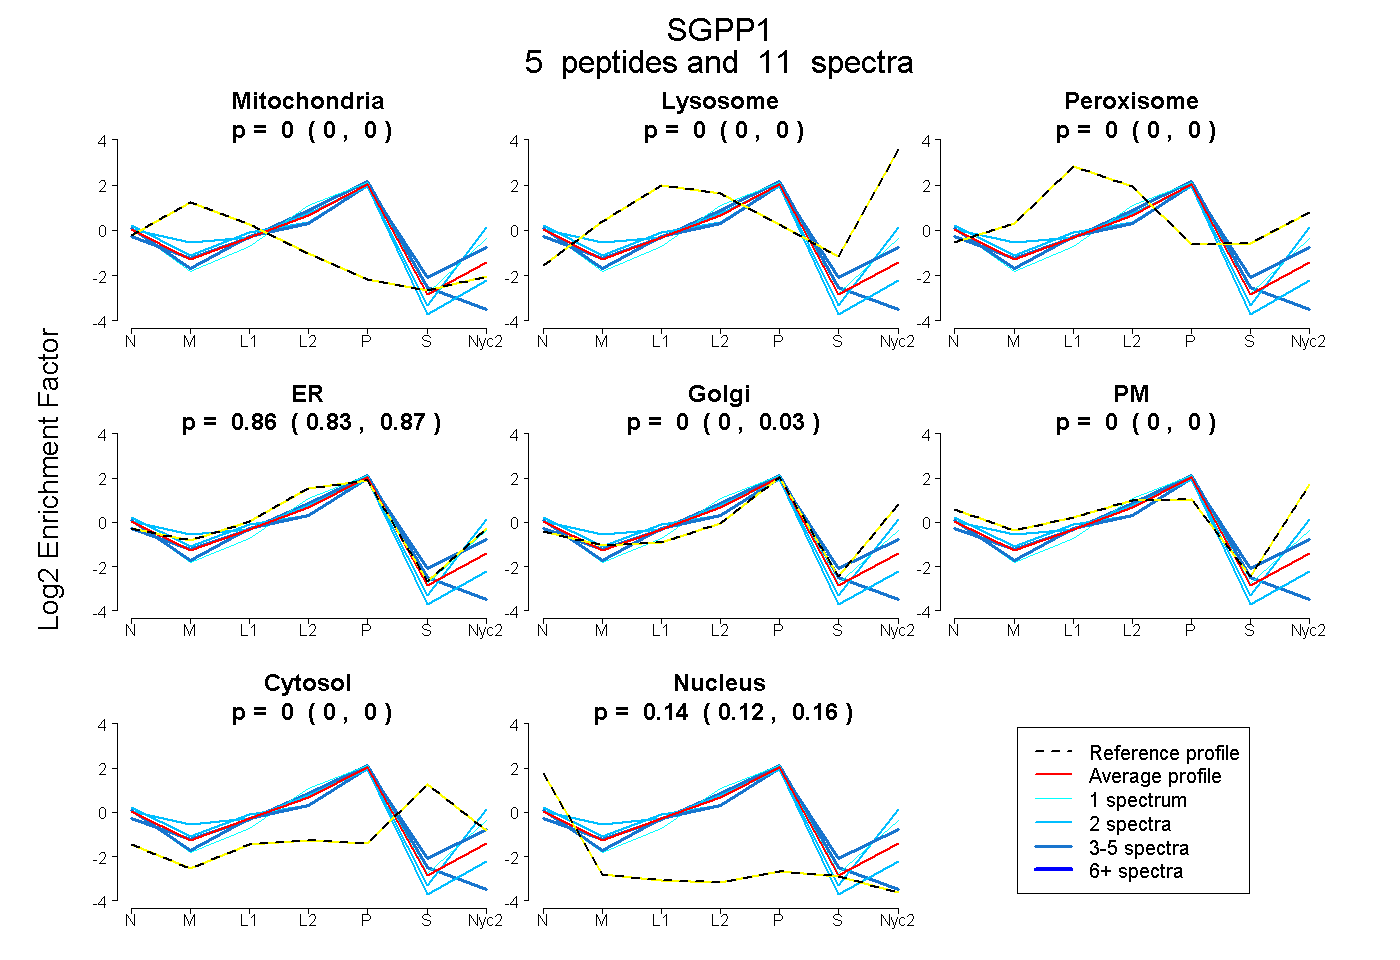
0.000 | 0.000
0.000 | 0.000
0.000 | 0.000
0.827 | 0.871
0.000 | 0.031
0.000 | 0.000
0.000 | 0.000
0.116 | 0.157
4peptides
spectra
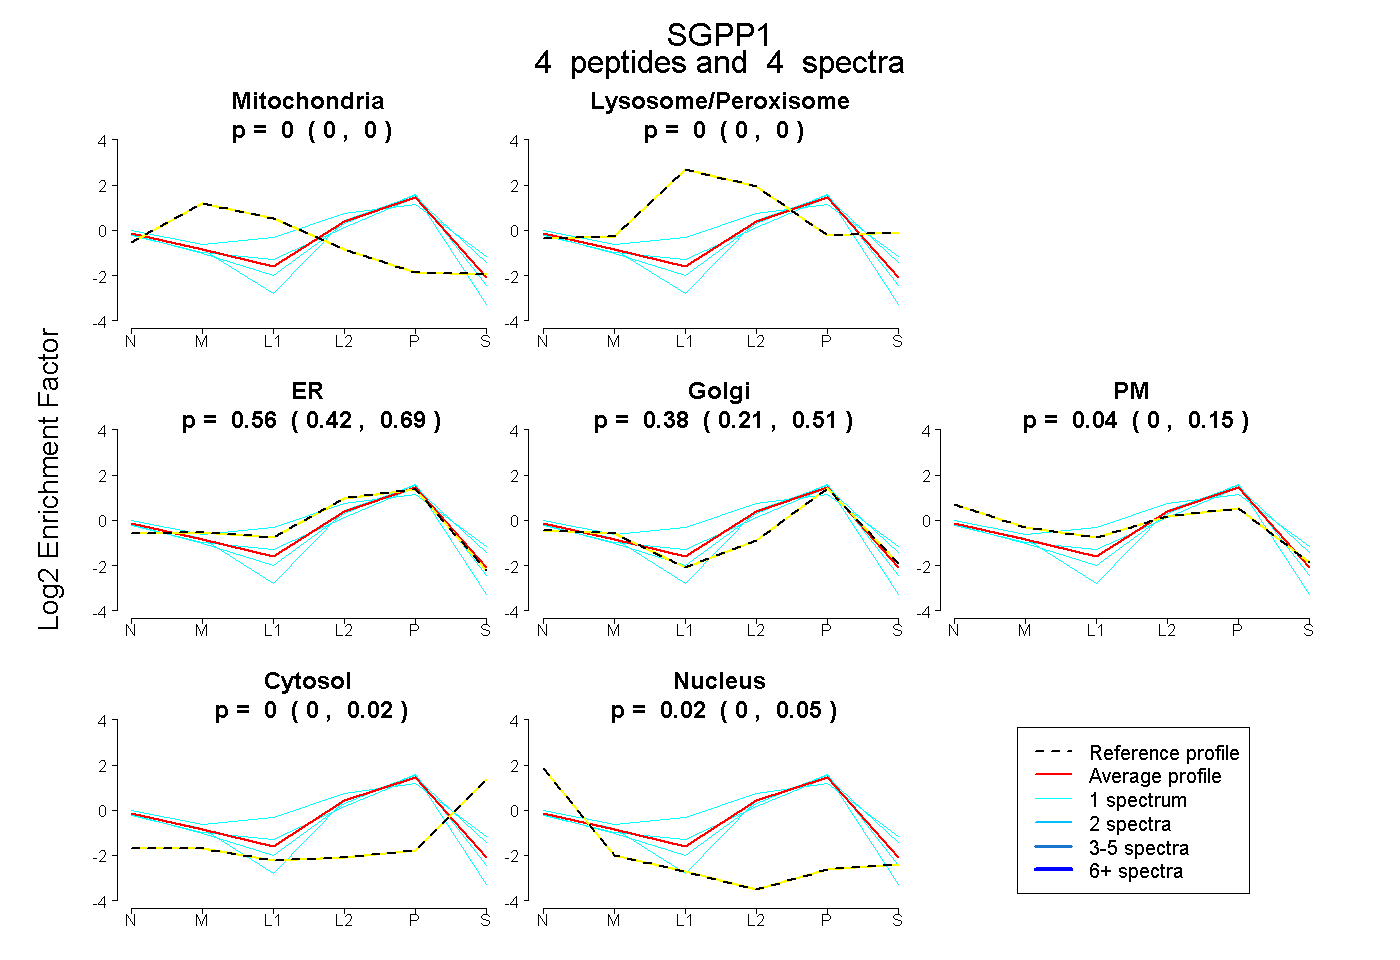
0.000 | 0.000
0.000 | 0.000
0.422 | 0.691
0.211 | 0.514
0.000 | 0.149
0.000 | 0.025
0.000 | 0.047
4peptides
spectra
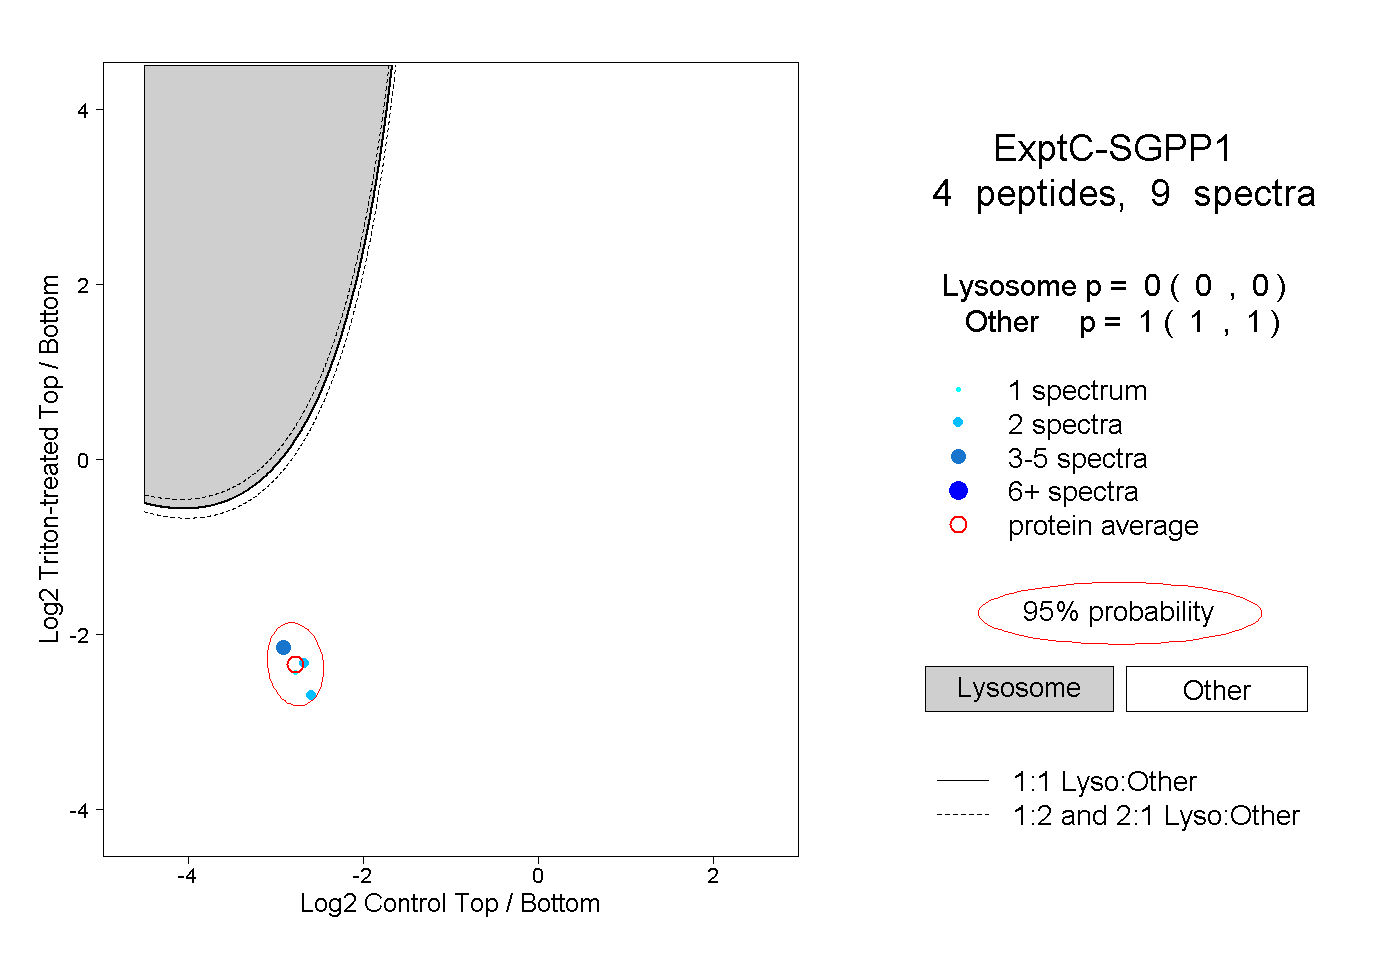
0.000 | 0.000
1.000 | 1.000
1peptide
spectrum
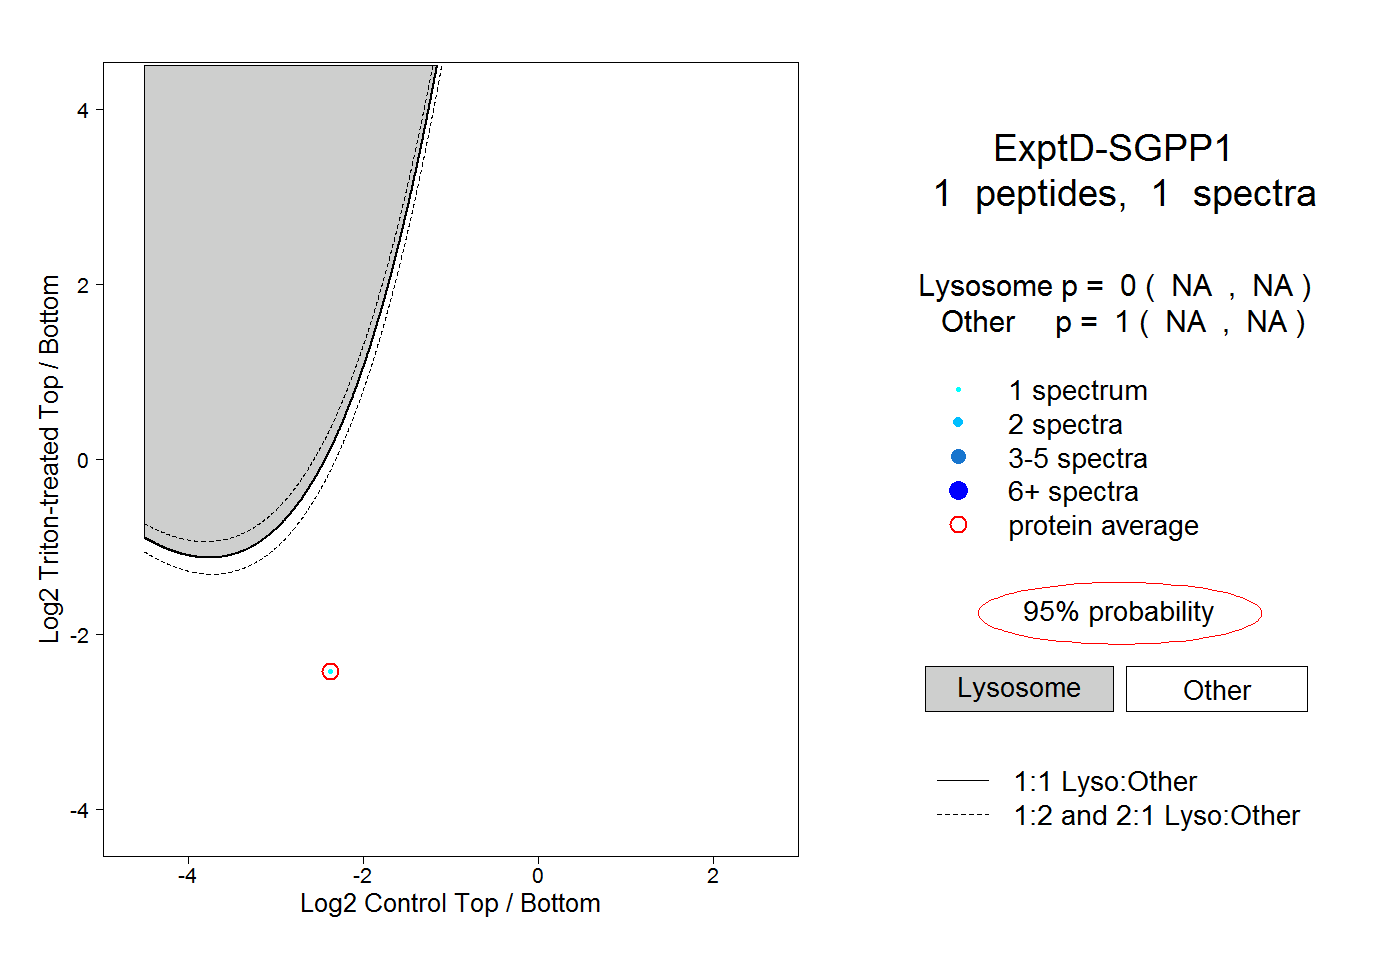
NA | NA
NA | NA