 4
4peptides
spectra
0.000 | 0.000
0.000 | 0.000
0.000 | 0.000
0.000 | 0.110
0.000 | 0.138
0.000 | 0.000
0.331 | 0.403
0.474 | 0.574
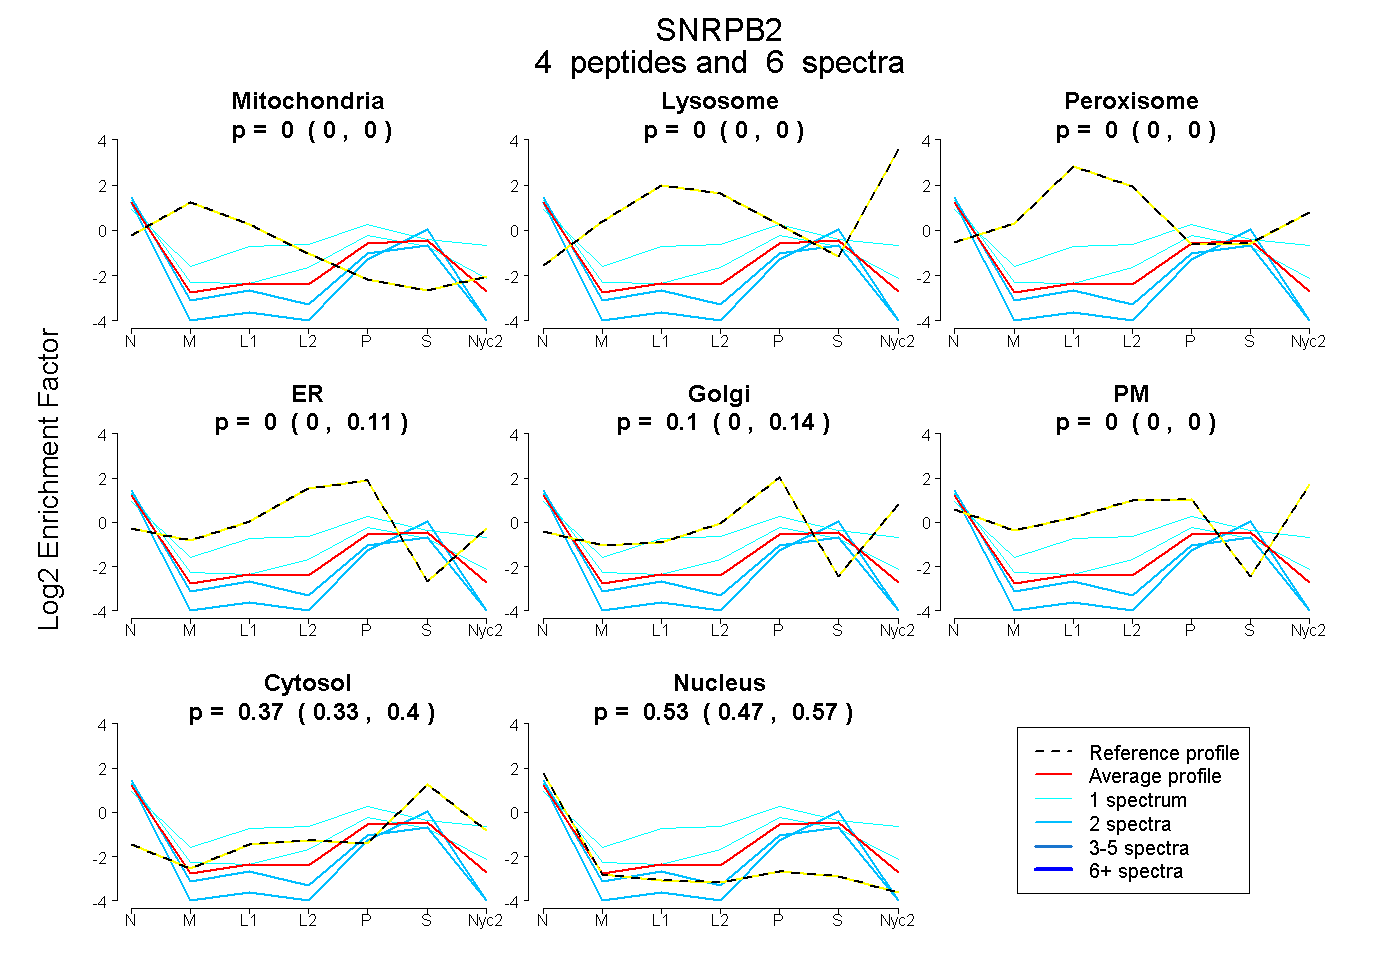
| Plot | Mito | Lyso | Perox | ER | Golgi | PM | Cytosol | Nucleus | |||||
| Expt A |
4 peptides |
6 spectra |
|
0.000 0.000 | 0.000 |
0.000 0.000 | 0.000 |
0.000 0.000 | 0.000 |
0.000 0.000 | 0.110 |
0.101 0.000 | 0.138 |
0.000 0.000 | 0.000 |
0.370 0.331 | 0.403 |
0.529 0.474 | 0.574 |
| 2 spectra, ELGSSTNALR | 0.000 | 0.000 | 0.000 | 0.000 | 0.000 | 0.000 | 0.271 | 0.729 | ||
| 2 spectra, QLQGFPFYGKPMR | 0.000 | 0.000 | 0.000 | 0.000 | 0.000 | 0.000 | 0.268 | 0.732 | ||
| 1 spectrum, ITPSHAMK | 0.000 | 0.000 | 0.000 | 0.053 | 0.205 | 0.000 | 0.285 | 0.457 | ||
| 1 spectrum, GTFADK | 0.000 | 0.000 | 0.007 | 0.108 | 0.000 | 0.349 | 0.370 | 0.166 |
| Plot | Mito | Lyso or Perox | ER | Golgi | PM | Cytosol | Nucleus | ||||||
| Expt B |
1 peptide |
1 spectrum |
 |
0.000 NA | NA |
0.129 NA | NA |
0.000 NA | NA |
0.000 NA | NA |
0.000 NA | NA |
0.295 NA | NA |
0.576 NA | NA |