 2
2peptides
spectra
0.000 | 0.000
0.000 | 0.000
0.000 | 0.000
0.000 | 0.194
0.121 | 0.321
0.000 | 0.191
0.557 | 0.617
0.000 | 0.000
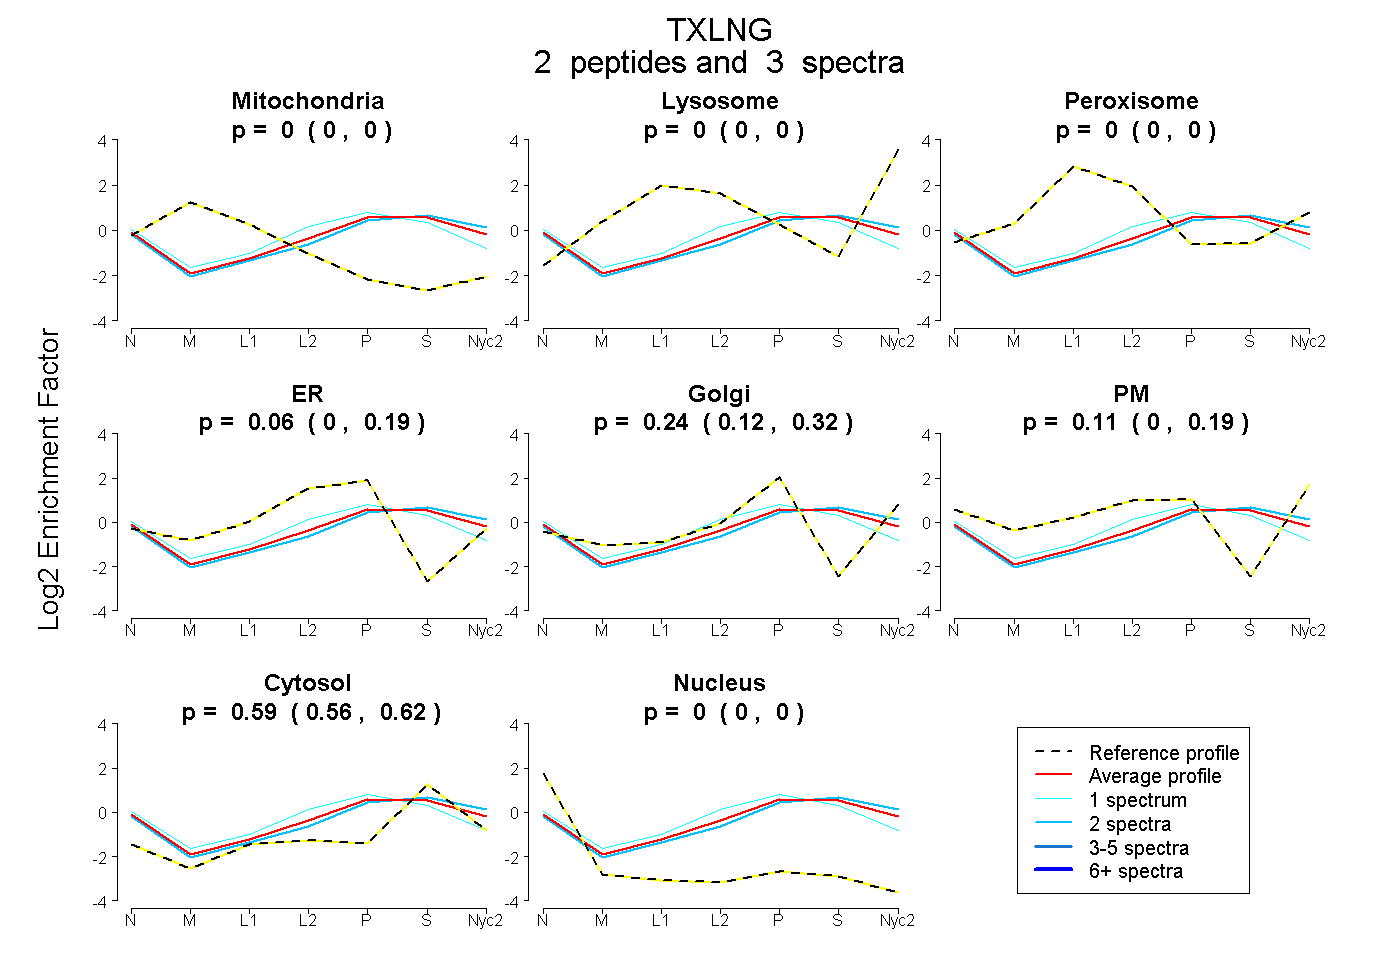
| Plot | Mito | Lyso | Perox | ER | Golgi | PM | Cytosol | Nucleus | |||||
| Expt A |
2 peptides |
3 spectra |
|
0.000 0.000 | 0.000 |
0.000 0.000 | 0.000 |
0.000 0.000 | 0.000 |
0.058 0.000 | 0.194 |
0.244 0.121 | 0.321 |
0.109 0.000 | 0.191 |
0.589 0.557 | 0.617 |
0.000 0.000 | 0.000 |
| 2 spectra, HSLEGDEGSDFVTNTR | 0.000 | 0.000 | 0.000 | 0.000 | 0.272 | 0.113 | 0.615 | 0.000 | ||
| 1 spectrum, TGPPDGQQDSECSR | 0.000 | 0.000 | 0.000 | 0.458 | 0.000 | 0.000 | 0.542 | 0.000 |
| Plot | Lyso | Other | |||||||||||
| Expt C |
2 peptides |
3 spectra |
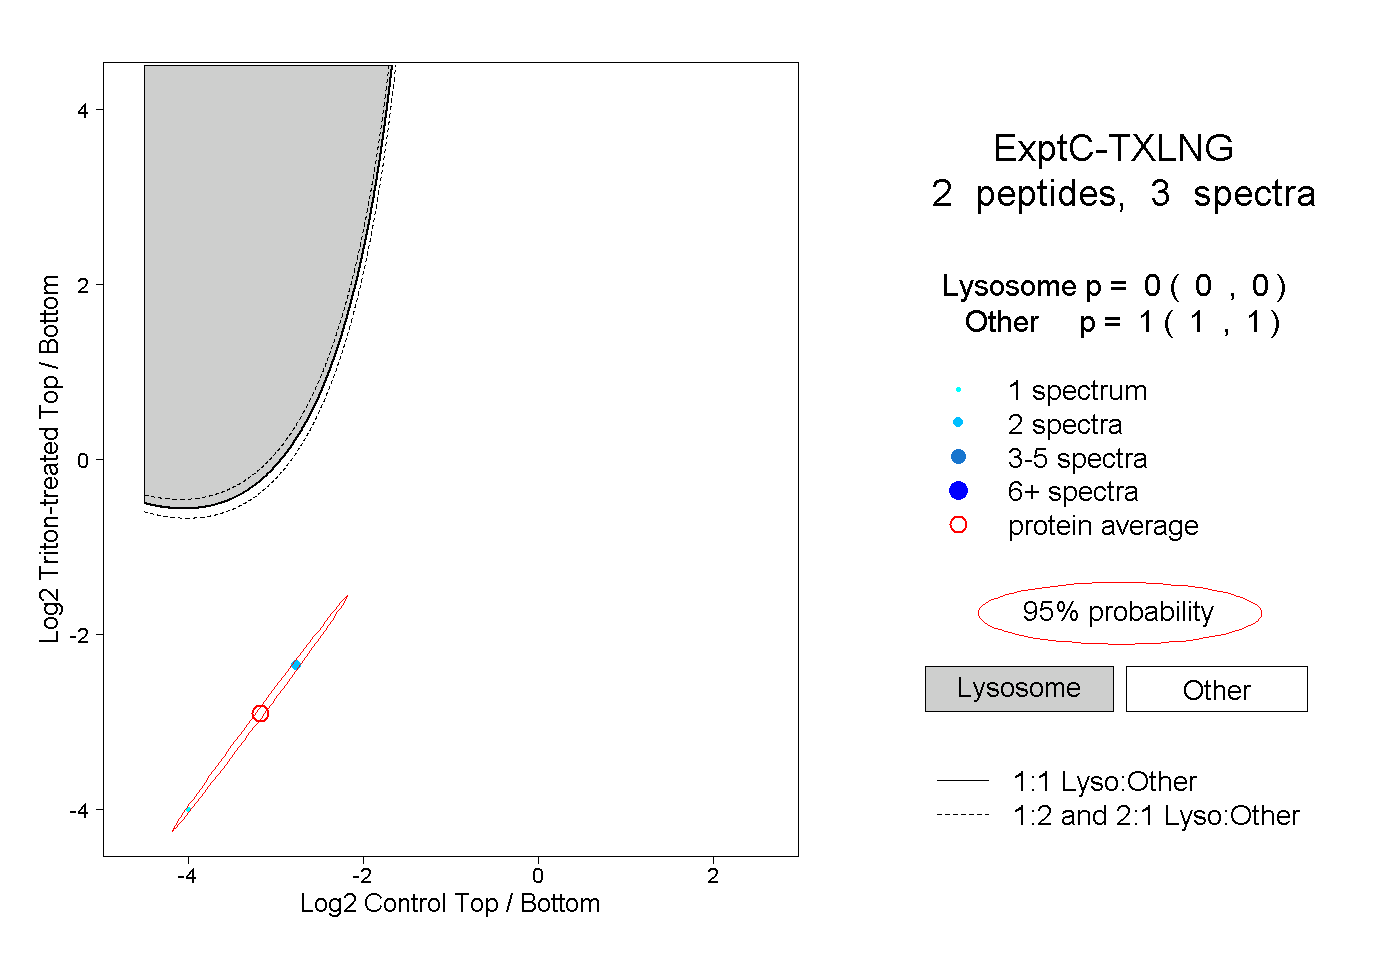 |
0.000 0.000 | 0.000 |
1.000 1.000 | 1.000 |