14
14peptides
spectra
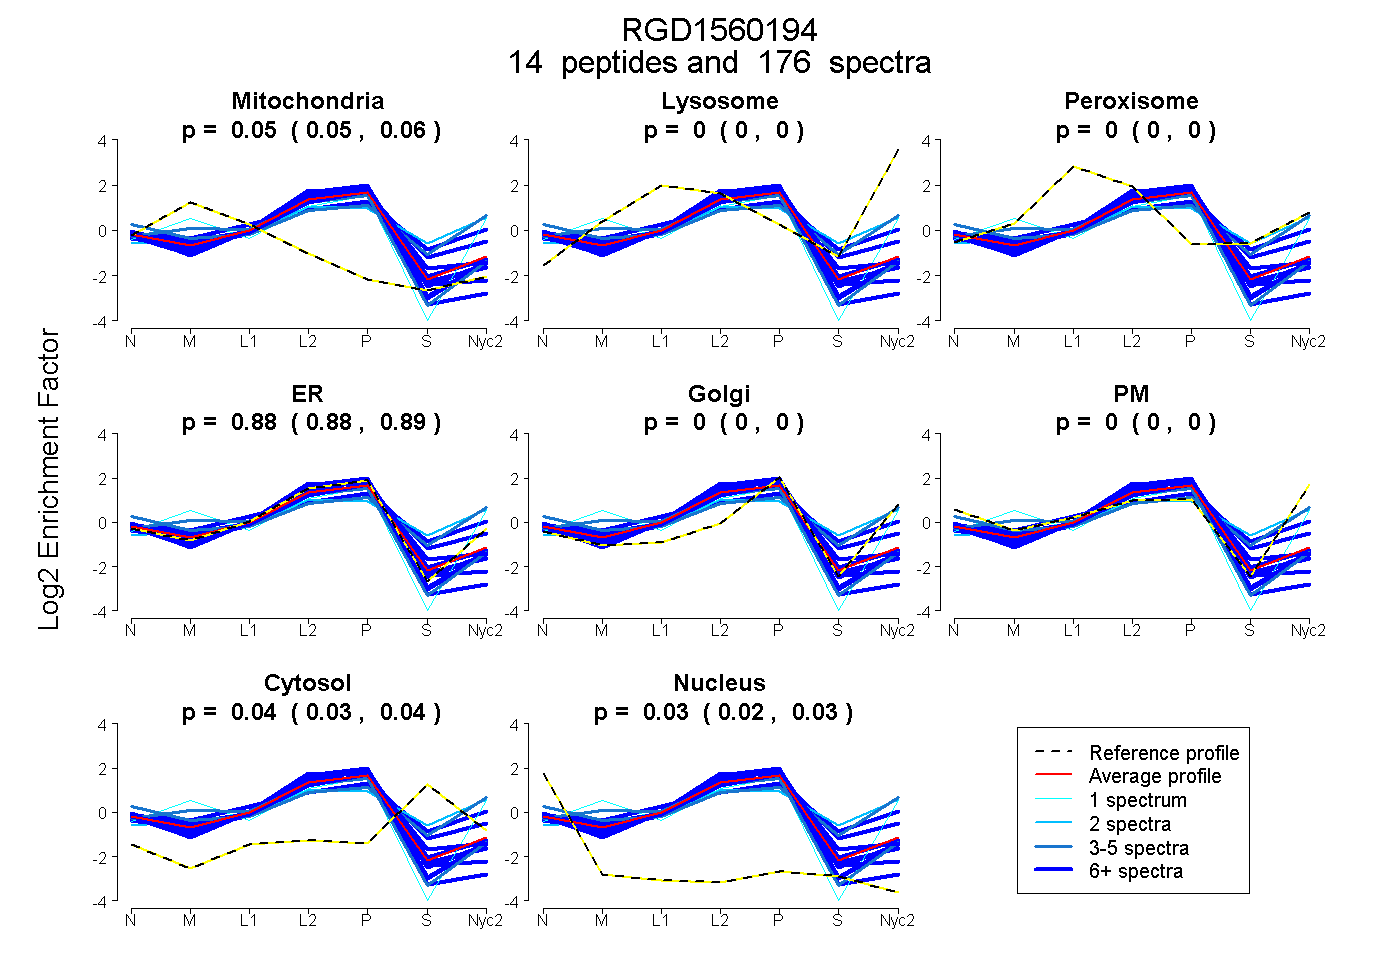
0.051 | 0.058
0.000 | 0.000
0.000 | 0.000
0.879 | 0.886
0.000 | 0.000
0.000 | 0.000
0.030 | 0.041
0.023 | 0.030
12peptides
spectra
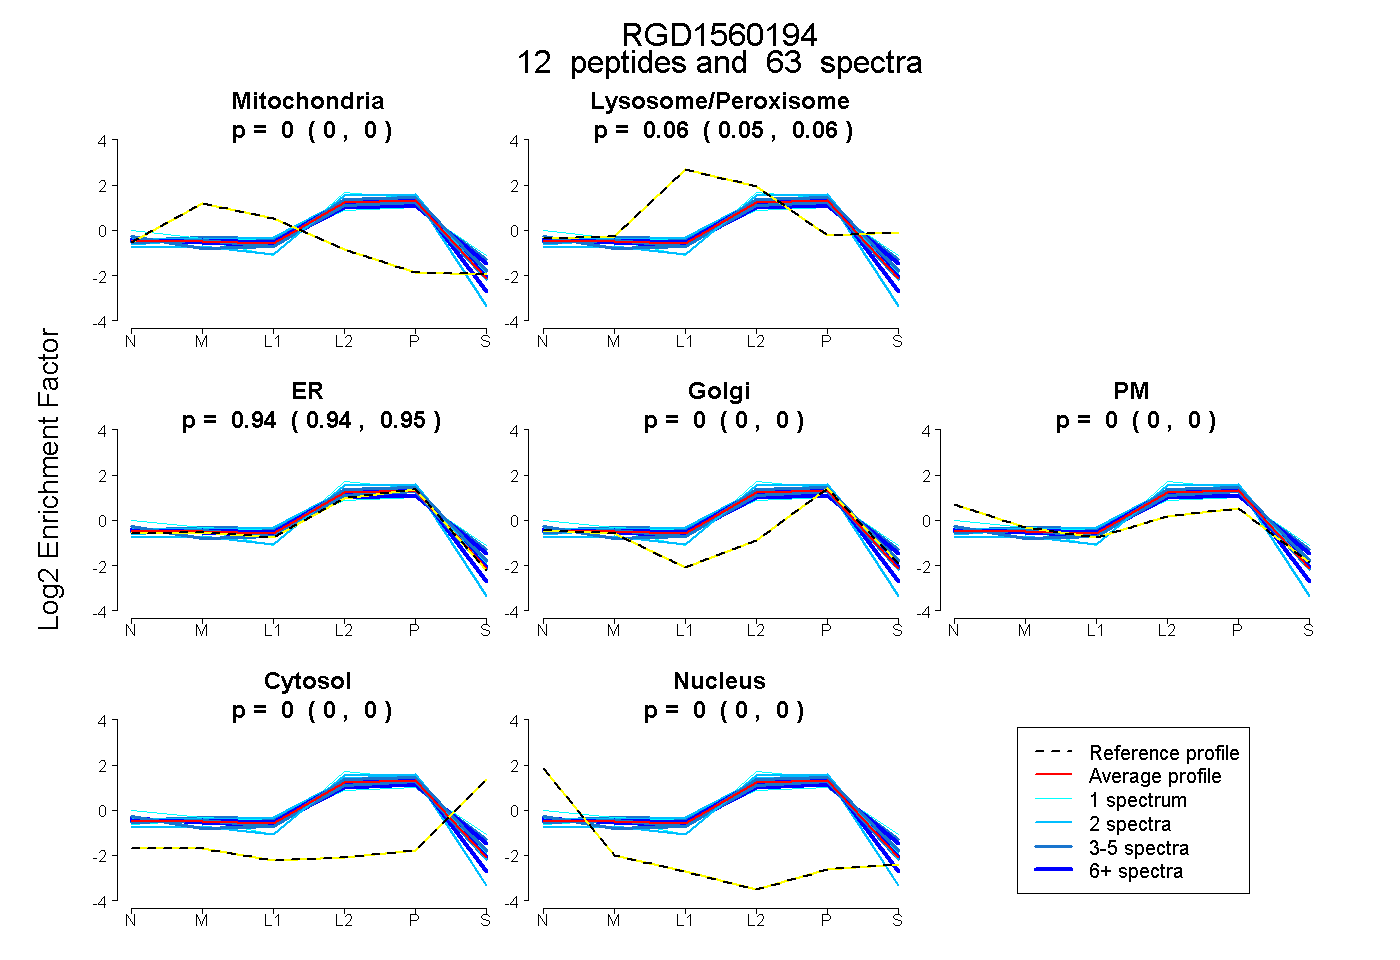
0.000 | 0.000
0.051 | 0.061
0.938 | 0.948
0.000 | 0.000
0.000 | 0.000
0.000 | 0.000
0.000 | 0.000