 12
12peptides
spectra
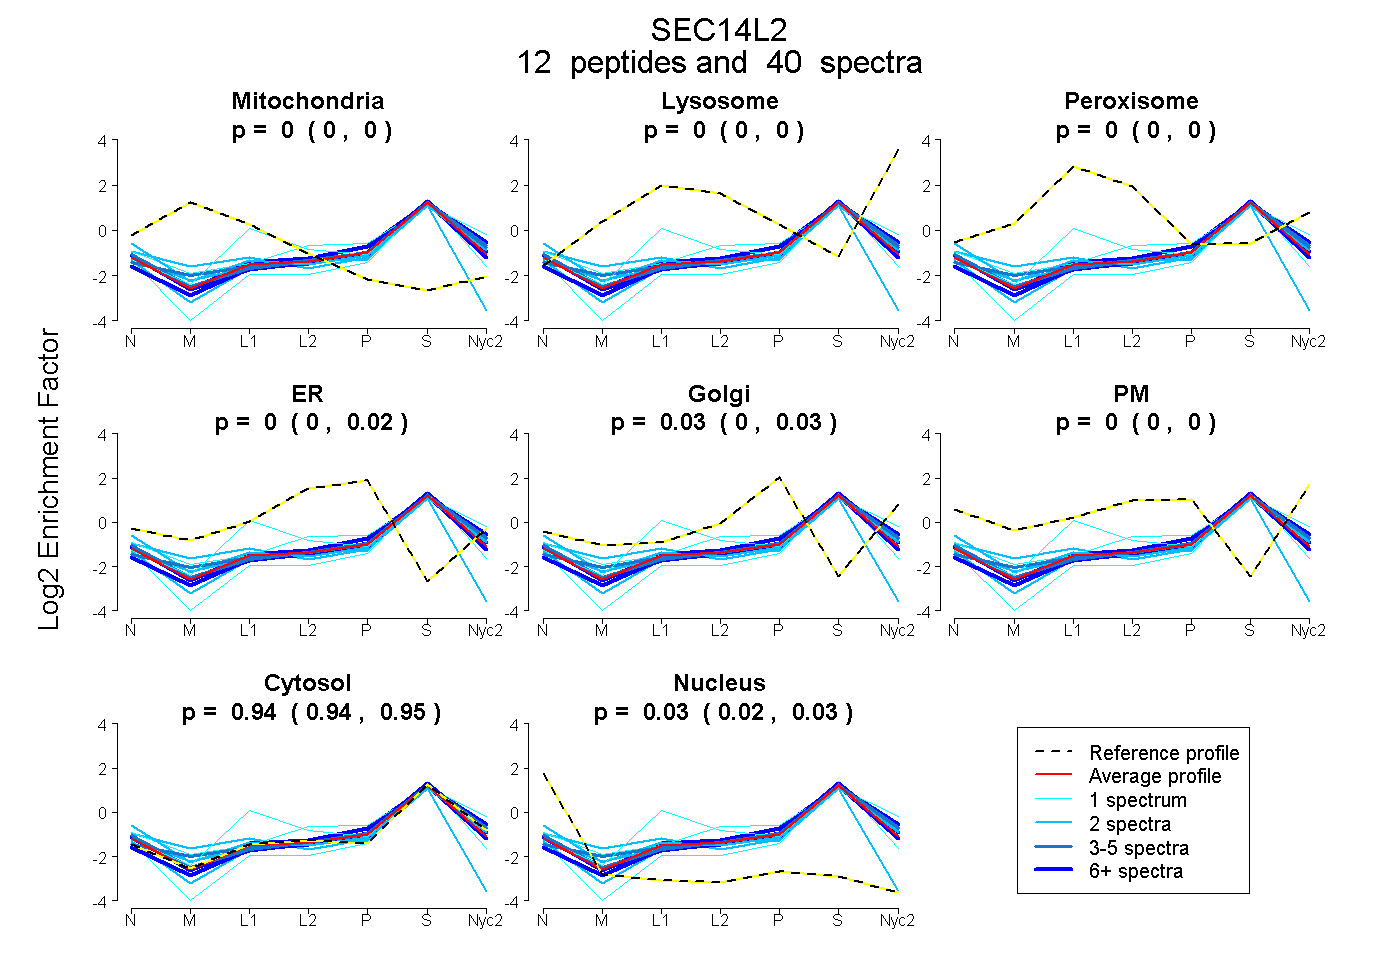
0.000 | 0.000
0.000 | 0.000
0.000 | 0.000
0.000 | 0.017
0.003 | 0.034
0.000 | 0.000
0.939 | 0.946
0.022 | 0.034
5peptides
spectra
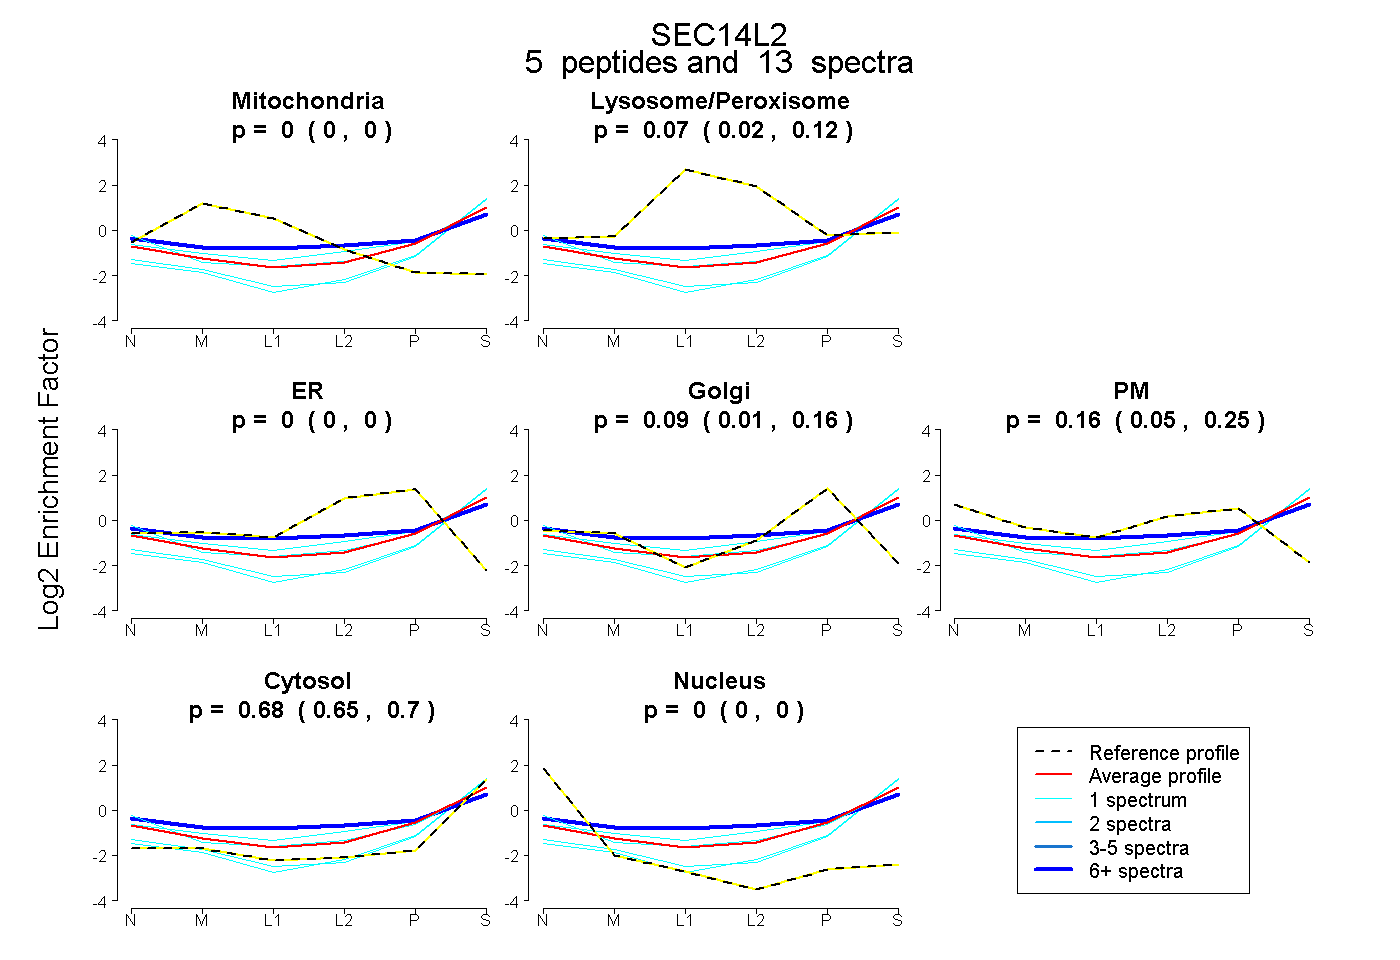
0.000 | 0.000
0.024 | 0.121
0.000 | 0.000
0.014 | 0.156
0.055 | 0.248
0.650 | 0.696
0.000 | 0.000
14peptides
spectra
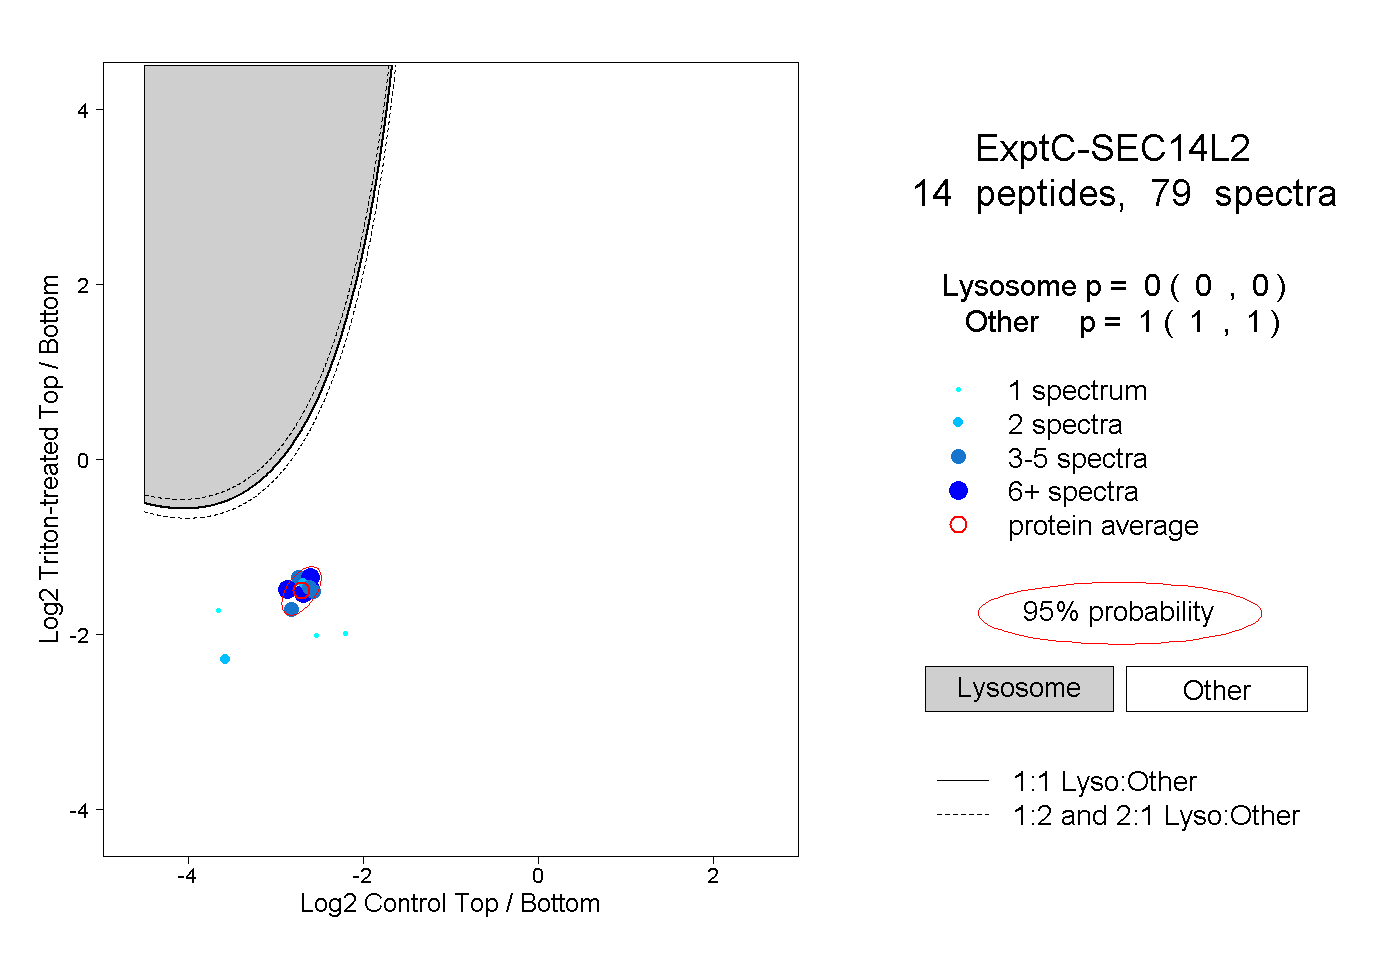
0.000 | 0.000
1.000 | 1.000
3peptides
spectra
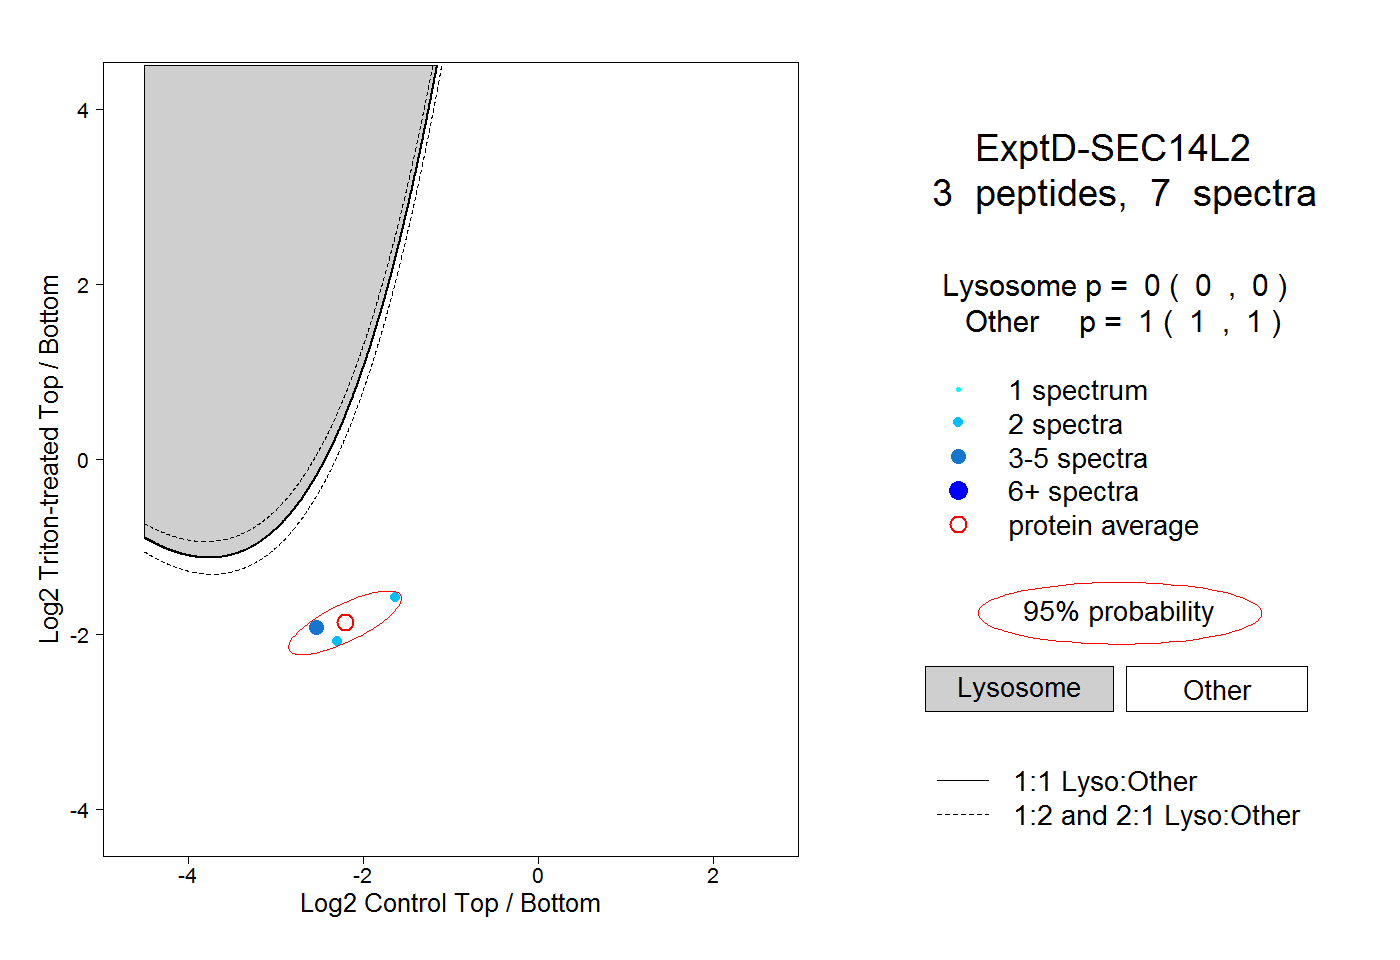
0.000 | 0.000
1.000 | 1.000