 19
19peptides
spectra
0.956 | 0.962
0.000 | 0.000
0.000 | 0.000
0.000 | 0.000
0.000 | 0.000
0.000 | 0.000
0.000 | 0.000
0.037 | 0.043
| Plot | Mito | Lyso | Perox | ER | Golgi | PM | Cytosol | Nucleus | |||||
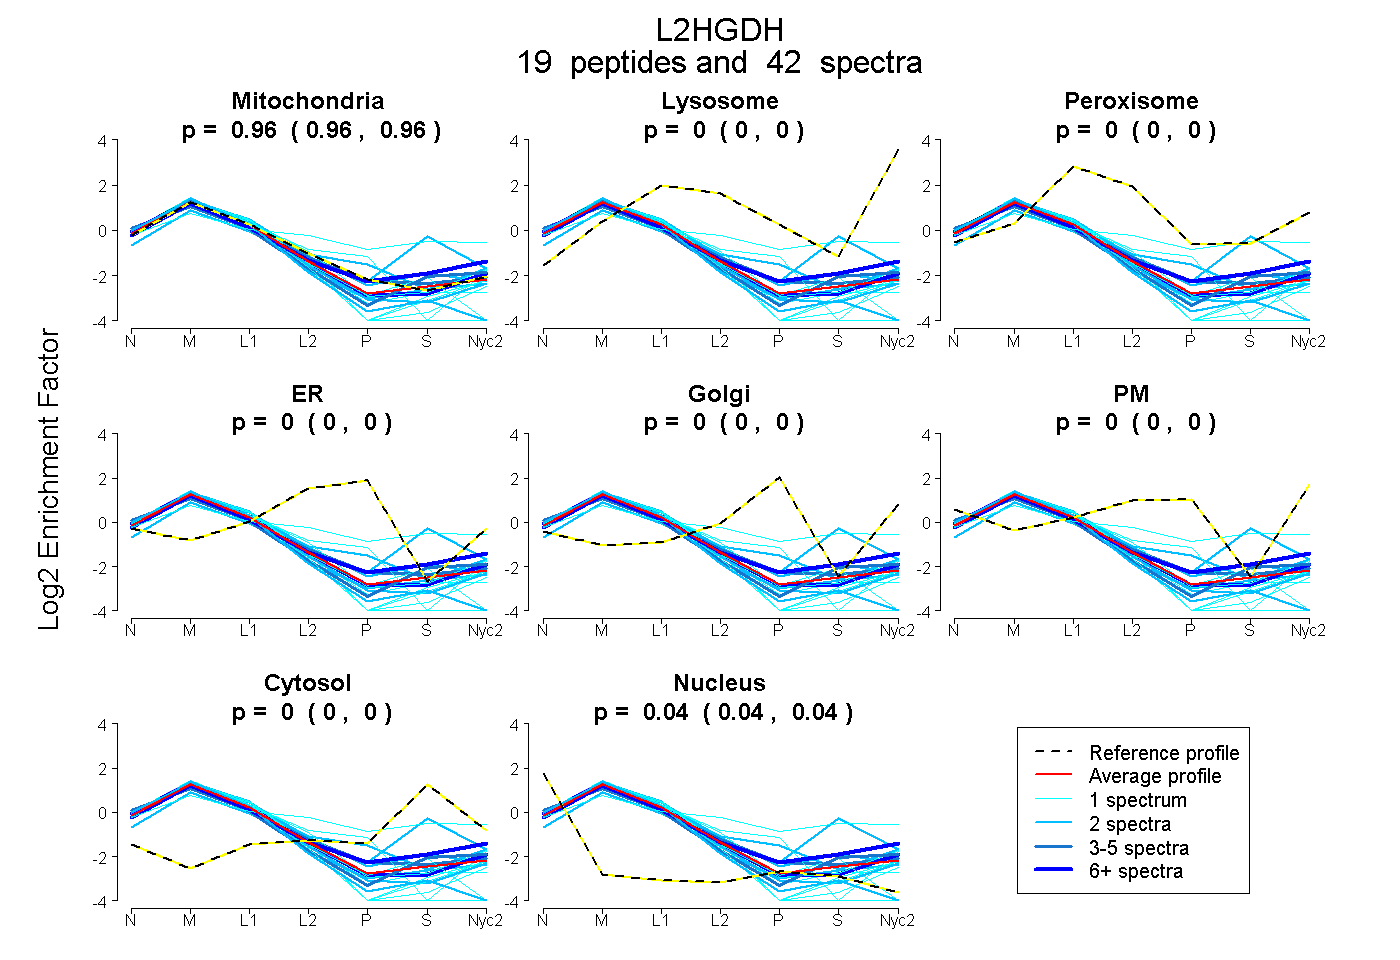
| Expt A |
19 peptides |
42 spectra |
|
0.960 0.956 | 0.962 |
0.000 0.000 | 0.000 |
0.000 0.000 | 0.000 |
0.000 0.000 | 0.000 |
0.000 0.000 | 0.000 |
0.000 0.000 | 0.000 |
0.000 0.000 | 0.000 |
0.040 0.037 | 0.043 |
| 1 spectrum, LCVEGAALIYEYCNLK | 0.894 | 0.000 | 0.000 | 0.000 | 0.000 | 0.000 | 0.000 | 0.106 | ||
| 1 spectrum, LVFQNFSYGASEIYK | 0.956 | 0.000 | 0.000 | 0.000 | 0.000 | 0.000 | 0.000 | 0.044 | ||
| 1 spectrum, GDYLVLKPEK | 0.946 | 0.000 | 0.000 | 0.000 | 0.000 | 0.000 | 0.000 | 0.054 | ||
| 2 spectra, ACFLSETVK | 0.939 | 0.000 | 0.000 | 0.000 | 0.000 | 0.000 | 0.061 | 0.000 | ||
| 7 spectra, GPAGVR | 0.974 | 0.000 | 0.000 | 0.000 | 0.000 | 0.000 | 0.000 | 0.026 | ||
| 2 spectra, YVVTCAGLYSDR | 0.866 | 0.000 | 0.000 | 0.000 | 0.000 | 0.000 | 0.000 | 0.134 | ||
| 2 spectra, LIVAVEQEEIPR | 0.947 | 0.000 | 0.000 | 0.000 | 0.000 | 0.000 | 0.000 | 0.053 | ||
| 1 spectrum, HPELSIGVVEK | 0.963 | 0.000 | 0.000 | 0.000 | 0.000 | 0.000 | 0.000 | 0.037 | ||
| 2 spectra, AQALDR | 0.881 | 0.000 | 0.000 | 0.000 | 0.091 | 0.028 | 0.000 | 0.000 | ||
| 2 spectra, EGYRPFDFNAR | 0.646 | 0.000 | 0.028 | 0.000 | 0.000 | 0.000 | 0.325 | 0.000 | ||
| 6 spectra, MIAEEVQQR | 0.866 | 0.037 | 0.000 | 0.000 | 0.000 | 0.000 | 0.097 | 0.000 | ||
| 3 spectra, DIMEVILK | 0.915 | 0.000 | 0.007 | 0.000 | 0.000 | 0.000 | 0.019 | 0.059 | ||
| 1 spectrum, ISELSGCNPDPQIVPFR | 1.000 | 0.000 | 0.000 | 0.000 | 0.000 | 0.000 | 0.000 | 0.000 | ||
| 1 spectrum, GLQNGVQGLR | 0.835 | 0.000 | 0.000 | 0.165 | 0.000 | 0.000 | 0.000 | 0.000 | ||
| 1 spectrum, NAPSPAATSSLAISR | 0.401 | 0.034 | 0.198 | 0.000 | 0.000 | 0.118 | 0.250 | 0.000 | ||
| 1 spectrum, DGNLVDDFVFDGGAGEIGDR | 0.875 | 0.000 | 0.000 | 0.000 | 0.000 | 0.000 | 0.000 | 0.125 | ||
| 2 spectra, GNIYPVPDSR | 0.961 | 0.000 | 0.000 | 0.000 | 0.000 | 0.000 | 0.000 | 0.039 | ||
| 1 spectrum, FIPEITTNDVLR | 0.913 | 0.000 | 0.000 | 0.000 | 0.000 | 0.000 | 0.000 | 0.087 | ||
| 5 spectra, LQALYER | 0.915 | 0.000 | 0.000 | 0.000 | 0.000 | 0.000 | 0.043 | 0.042 |
| Plot | Mito | Lyso or Perox | ER | Golgi | PM | Cytosol | Nucleus | ||||||
| Expt B |
12 peptides |
28 spectra |
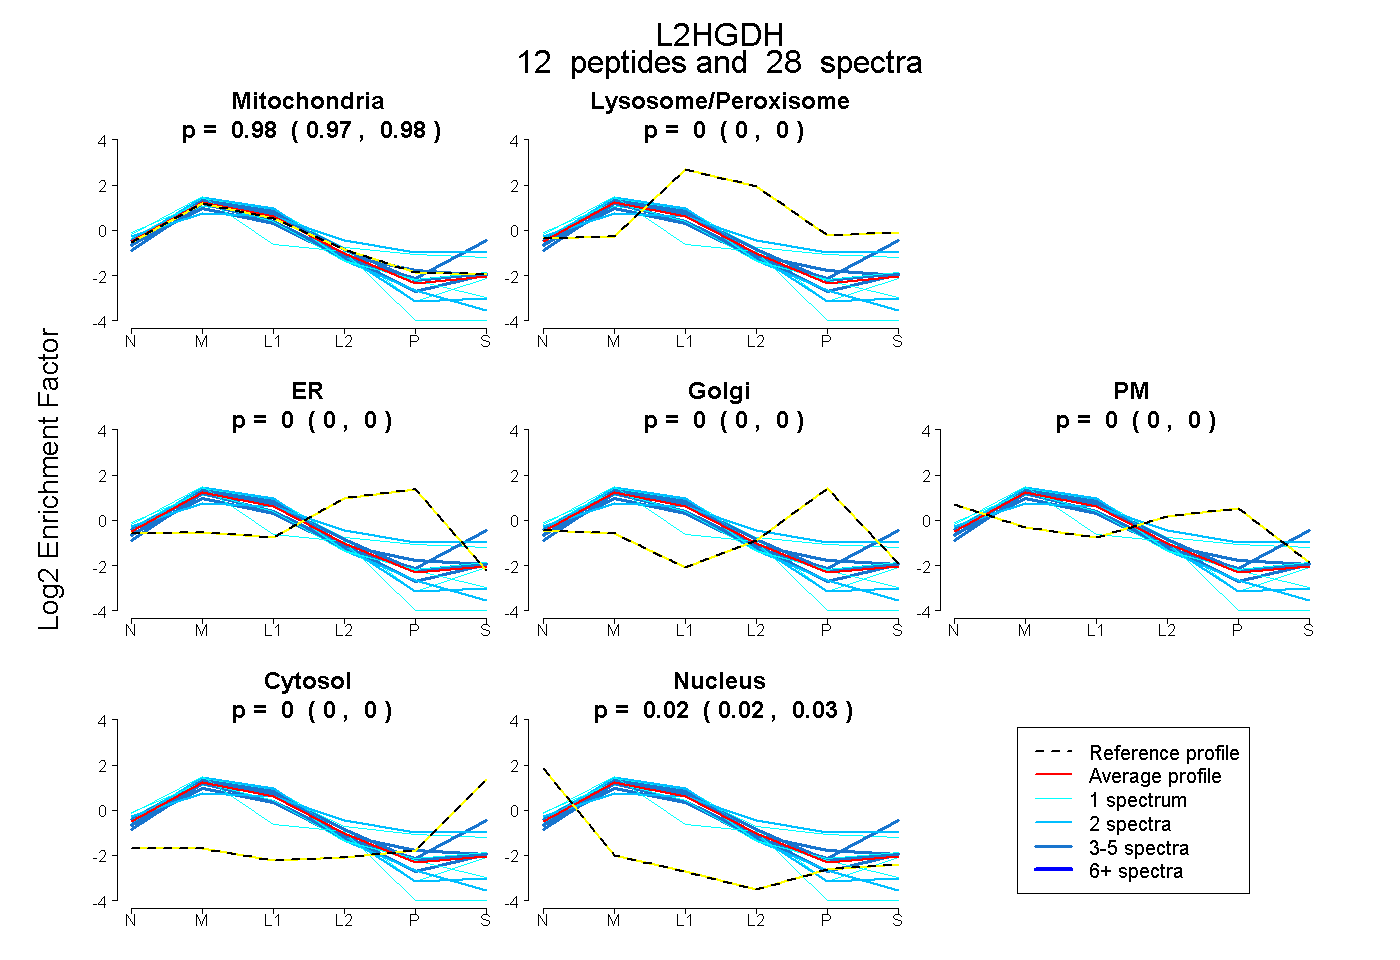 |
0.979 0.973 | 0.984 |
0.000 0.000 | 0.000 |
0.000 0.000 | 0.000 |
0.000 0.000 | 0.000 |
0.000 0.000 | 0.000 |
0.000 0.000 | 0.000 |
0.021 0.015 | 0.026 |
|||
| Plot | Lyso | Other | |||||||||||
| Expt C |
20 peptides |
138 spectra |
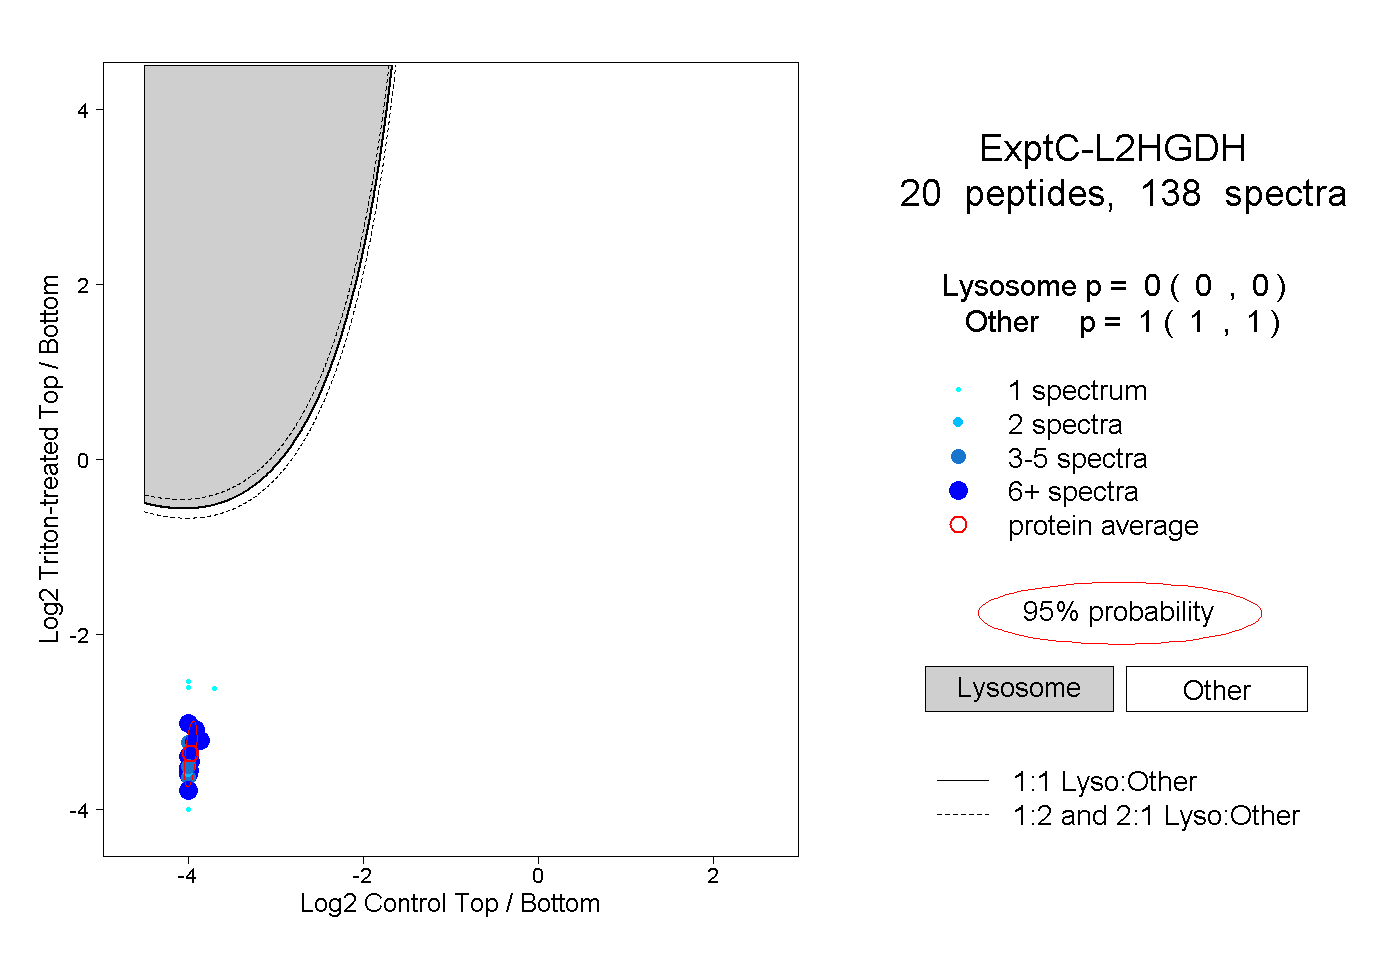 |
0.000 0.000 | 0.000 |
1.000 1.000 | 1.000 |
||||||||
| Plot | Lyso | Other | |||||||||||
| Expt D |
9 peptides |
19 spectra |
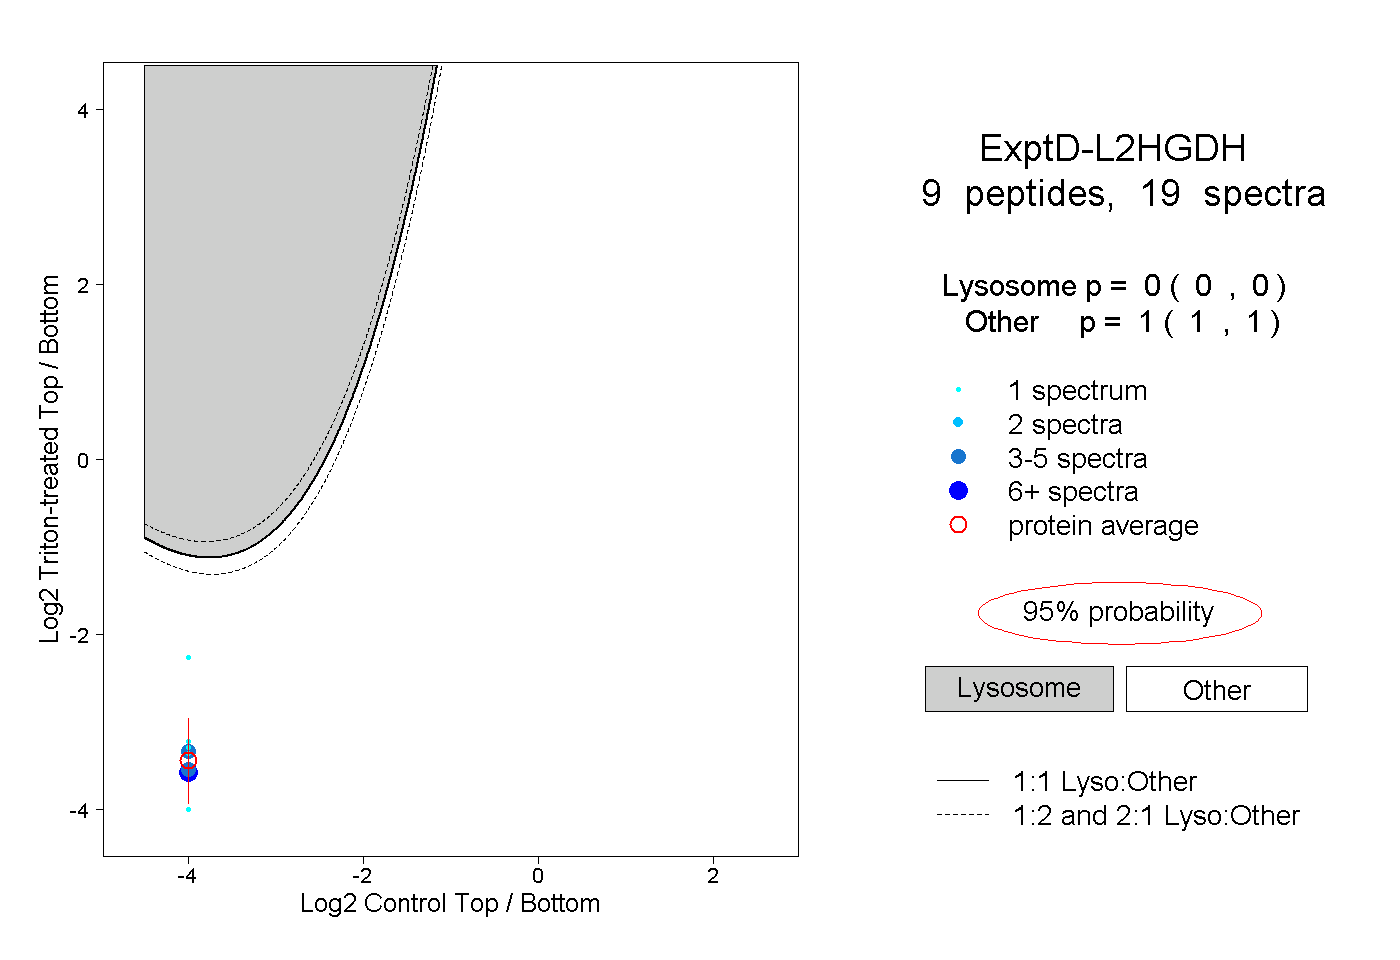 |
0.000 0.000 | 0.000 |
1.000 1.000 | 1.000 |