 3
3peptides
spectra
0.000 | 0.000
0.010 | 0.083
0.000 | 0.000
0.000 | 0.000
0.064 | 0.166
0.709 | 0.842
0.007 | 0.083
0.000 | 0.000
4peptides
spectra
0.000 | 0.000
1.000 | 1.000
| Plot | Mito | Lyso | Perox | ER | Golgi | PM | Cytosol | Nucleus | |||||
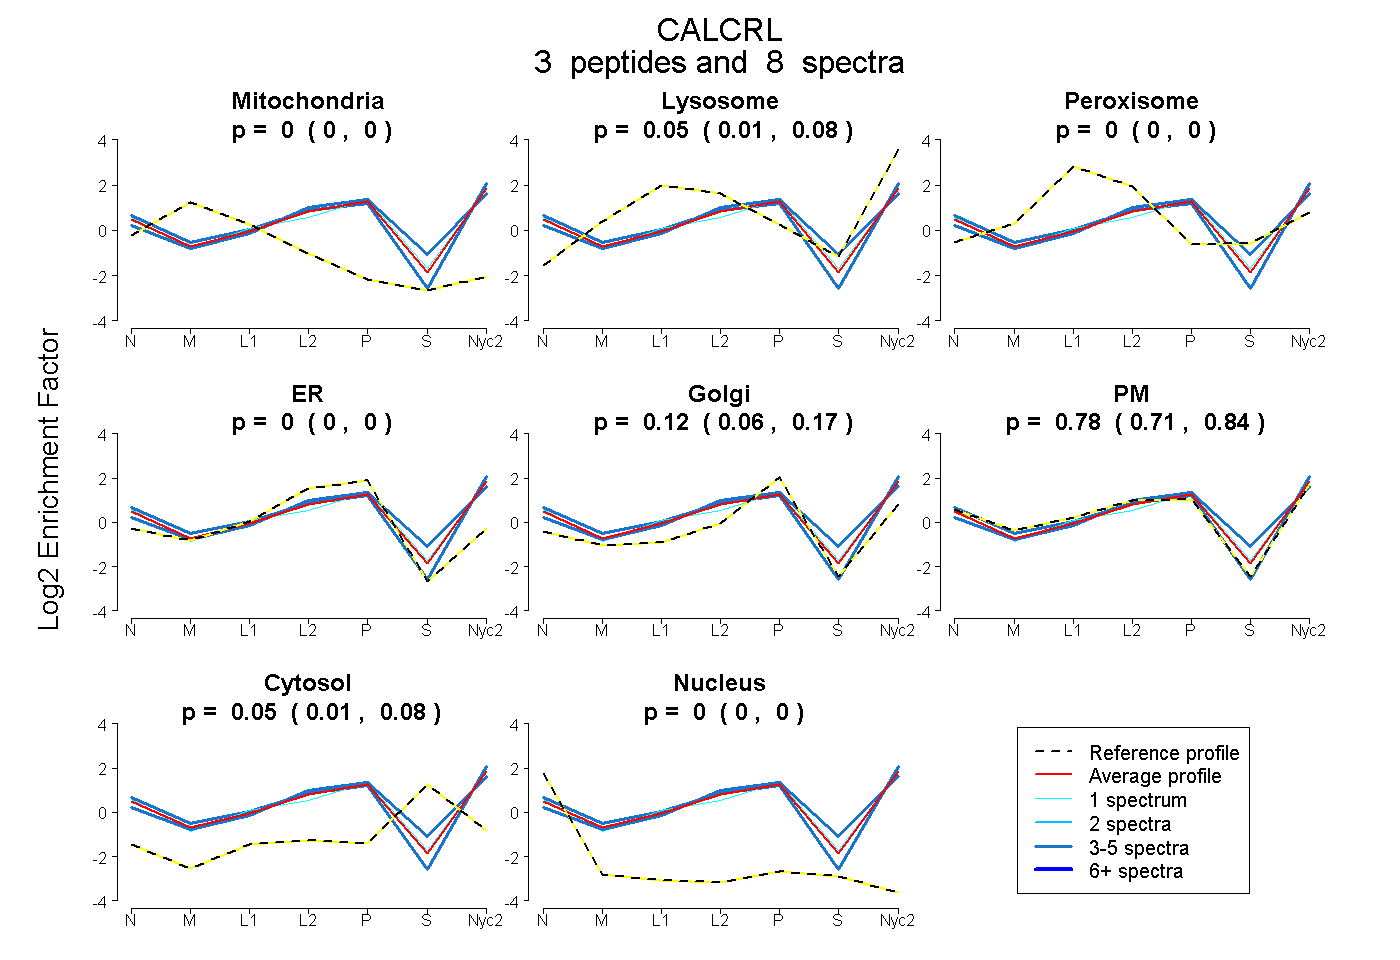
| Expt A |
3 peptides |
8 spectra |
|
0.000 0.000 | 0.000 |
0.050 0.010 | 0.083 |
0.000 0.000 | 0.000 |
0.000 0.000 | 0.000 |
0.119 0.064 | 0.166 |
0.782 0.709 | 0.842 |
0.049 0.007 | 0.083 |
0.000 0.000 | 0.000 |
||
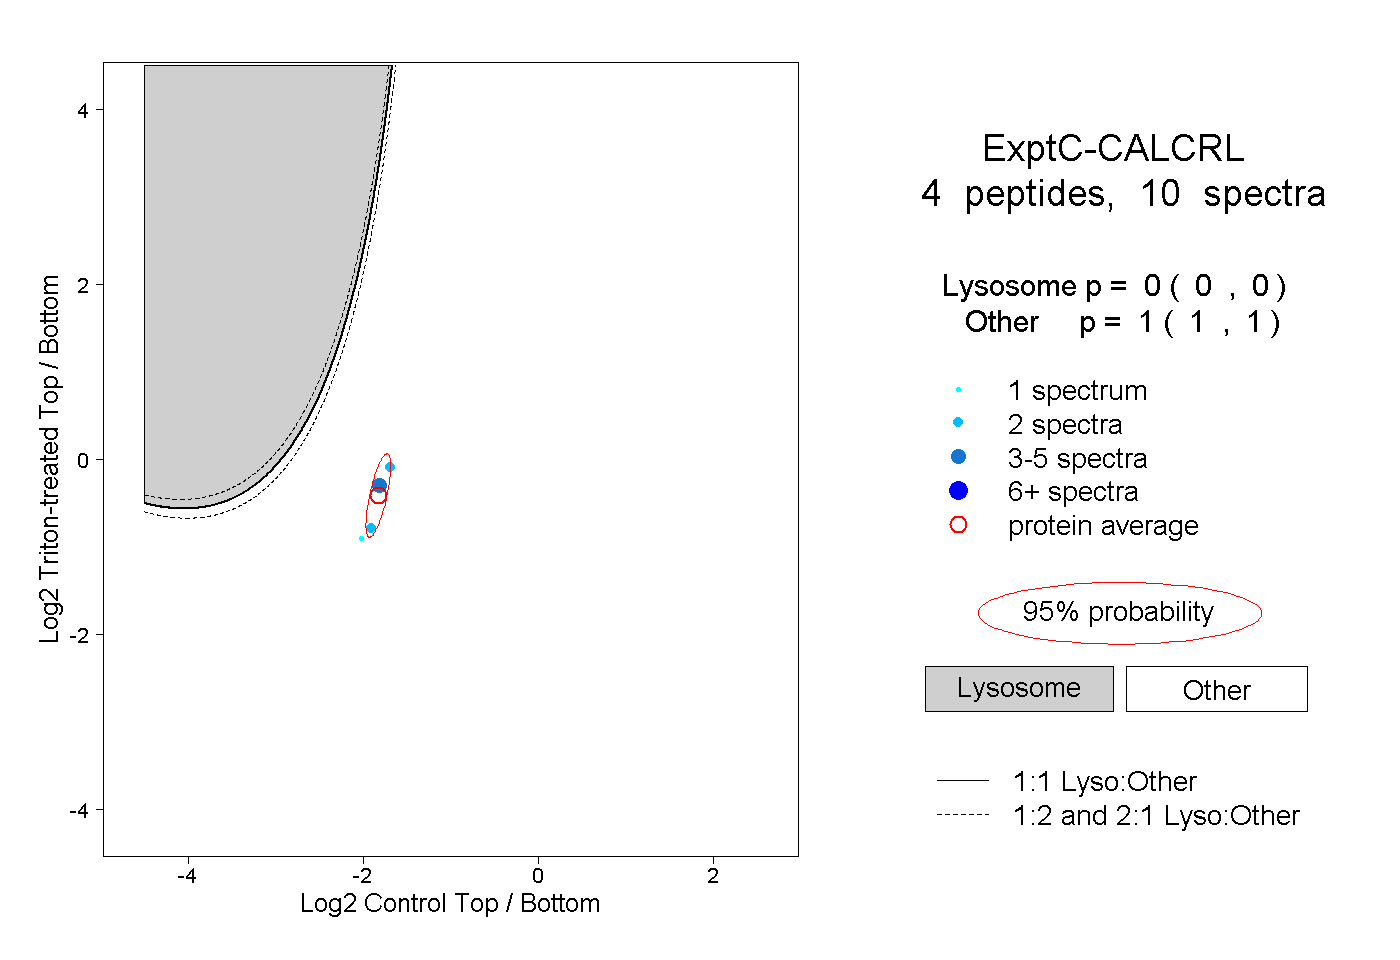
| Plot | Lyso | Other | |||||||||||
| Expt C |
4 peptides |
10 spectra |
|
0.000 0.000 | 0.000 |
1.000 1.000 | 1.000 |