 5
5peptides
spectra
0.000 | 0.000
0.000 | 0.000
0.000 | 0.000
0.000 | 0.000
0.000 | 0.000
0.000 | 0.000
0.980 | 0.997
0.002 | 0.019
| Plot | Mito | Lyso | Perox | ER | Golgi | PM | Cytosol | Nucleus | |||||
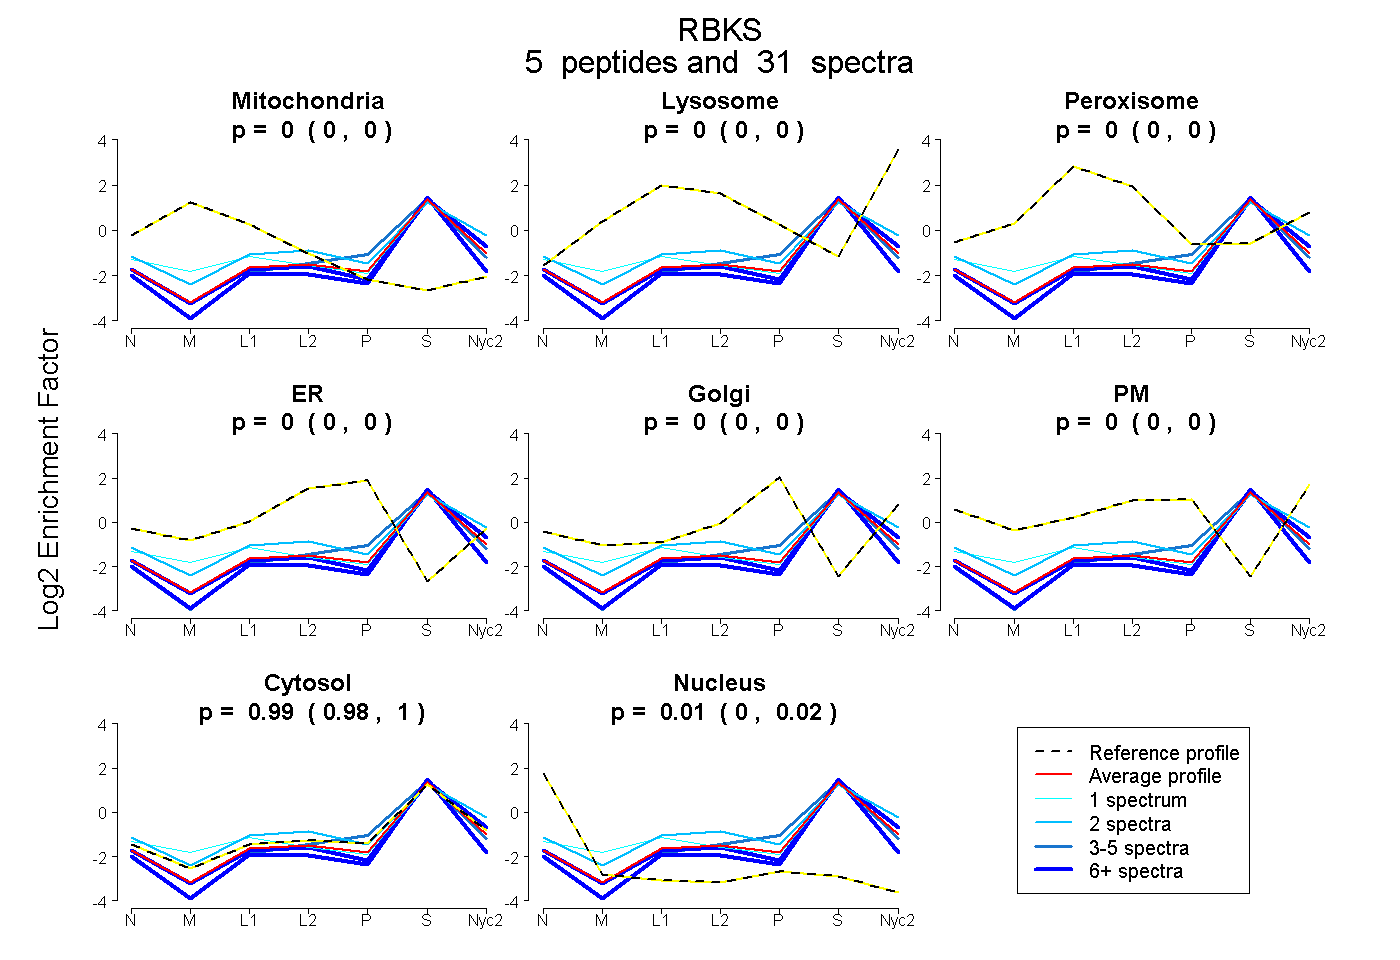
| Expt A |
5 peptides |
31 spectra |
|
0.000 0.000 | 0.000 |
0.000 0.000 | 0.000 |
0.000 0.000 | 0.000 |
0.000 0.000 | 0.000 |
0.000 0.000 | 0.000 |
0.000 0.000 | 0.000 |
0.989 0.980 | 0.997 |
0.011 0.002 | 0.019 |
| 9 spectra, FFIGFGGK | 0.000 | 0.000 | 0.000 | 0.000 | 0.000 | 0.000 | 0.991 | 0.009 | ||
| 3 spectra, AAHVISR | 0.000 | 0.000 | 0.000 | 0.000 | 0.000 | 0.000 | 1.000 | 0.000 | ||
| 2 spectra, TGETIHGHK | 0.000 | 0.071 | 0.030 | 0.000 | 0.000 | 0.000 | 0.899 | 0.000 | ||
| 16 spectra, GANQCVQAAR | 0.000 | 0.000 | 0.000 | 0.000 | 0.000 | 0.000 | 0.916 | 0.084 | ||
| 1 spectrum, HIPTEAVK | 0.108 | 0.000 | 0.000 | 0.000 | 0.000 | 0.000 | 0.892 | 0.000 |
| Plot | Mito | Lyso or Perox | ER | Golgi | PM | Cytosol | Nucleus | ||||||
| Expt B |
2 peptides |
5 spectra |
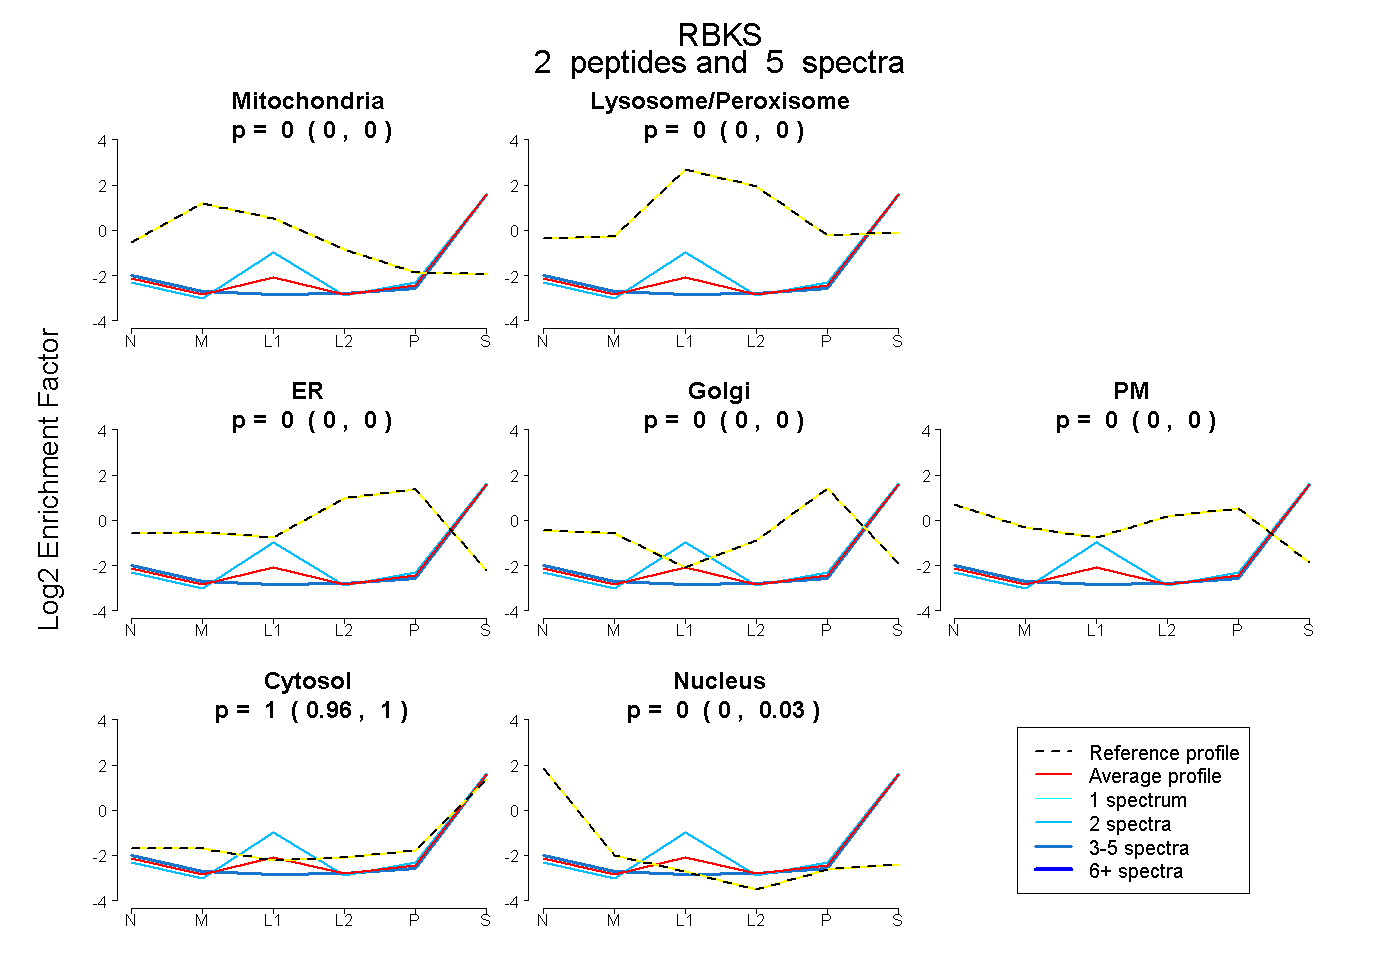 |
0.000 0.000 | 0.000 |
0.000 0.000 | 0.000 |
0.000 0.000 | 0.000 |
0.000 0.000 | 0.000 |
0.000 0.000 | 0.000 |
1.000 0.959 | 1.000 |
0.000 0.000 | 0.033 |
|||
| Plot | Lyso | Other | |||||||||||
| Expt C |
5 peptides |
17 spectra |
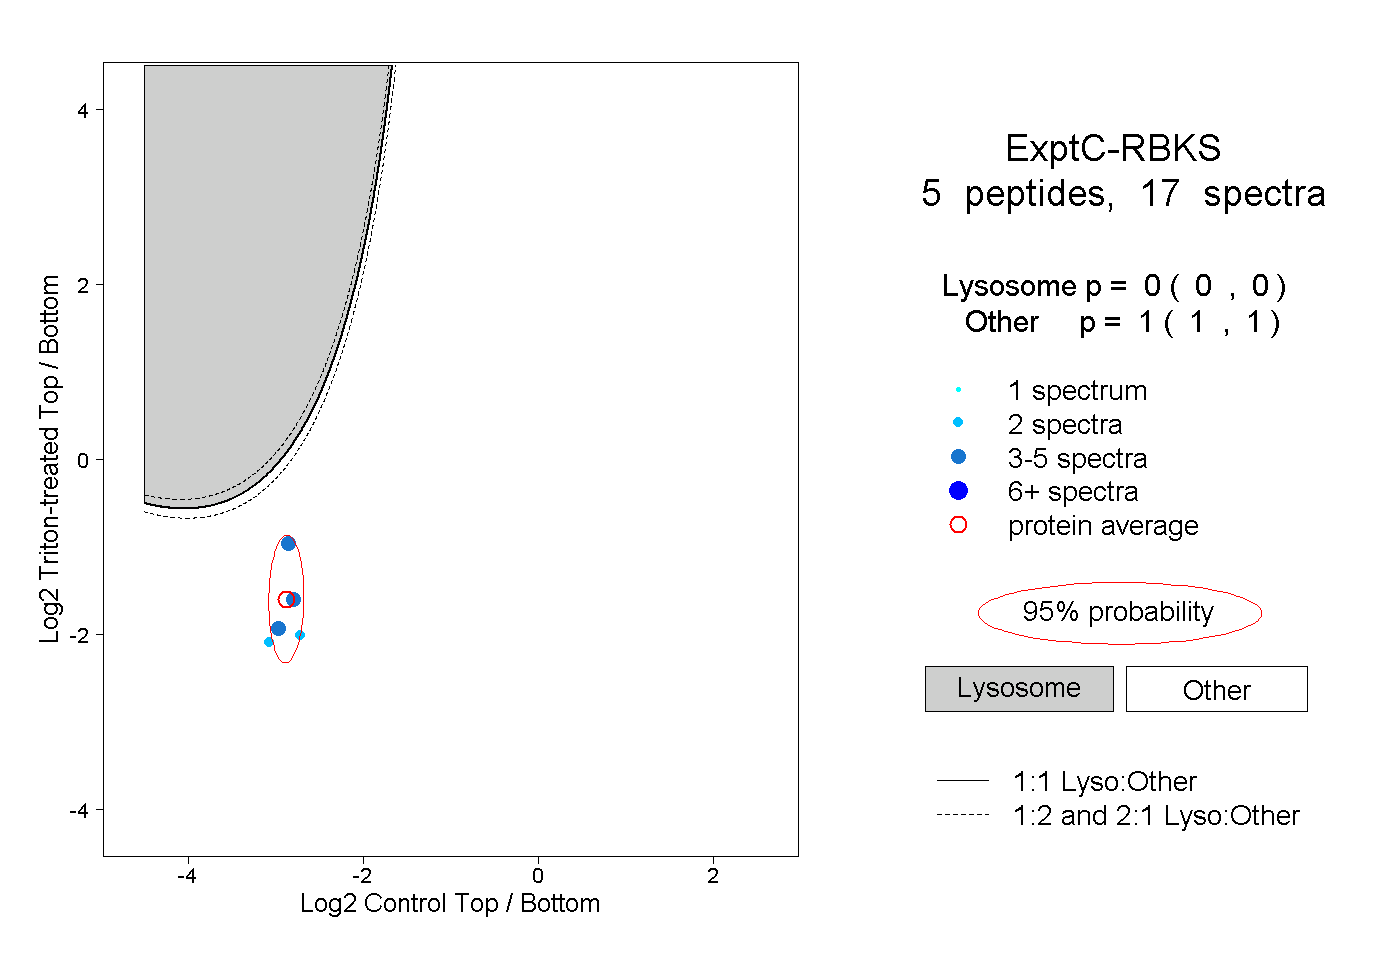 |
0.000 0.000 | 0.000 |
1.000 1.000 | 1.000 |
||||||||
| Plot | Lyso | Other | |||||||||||
| Expt D |
1 peptide |
2 spectra |
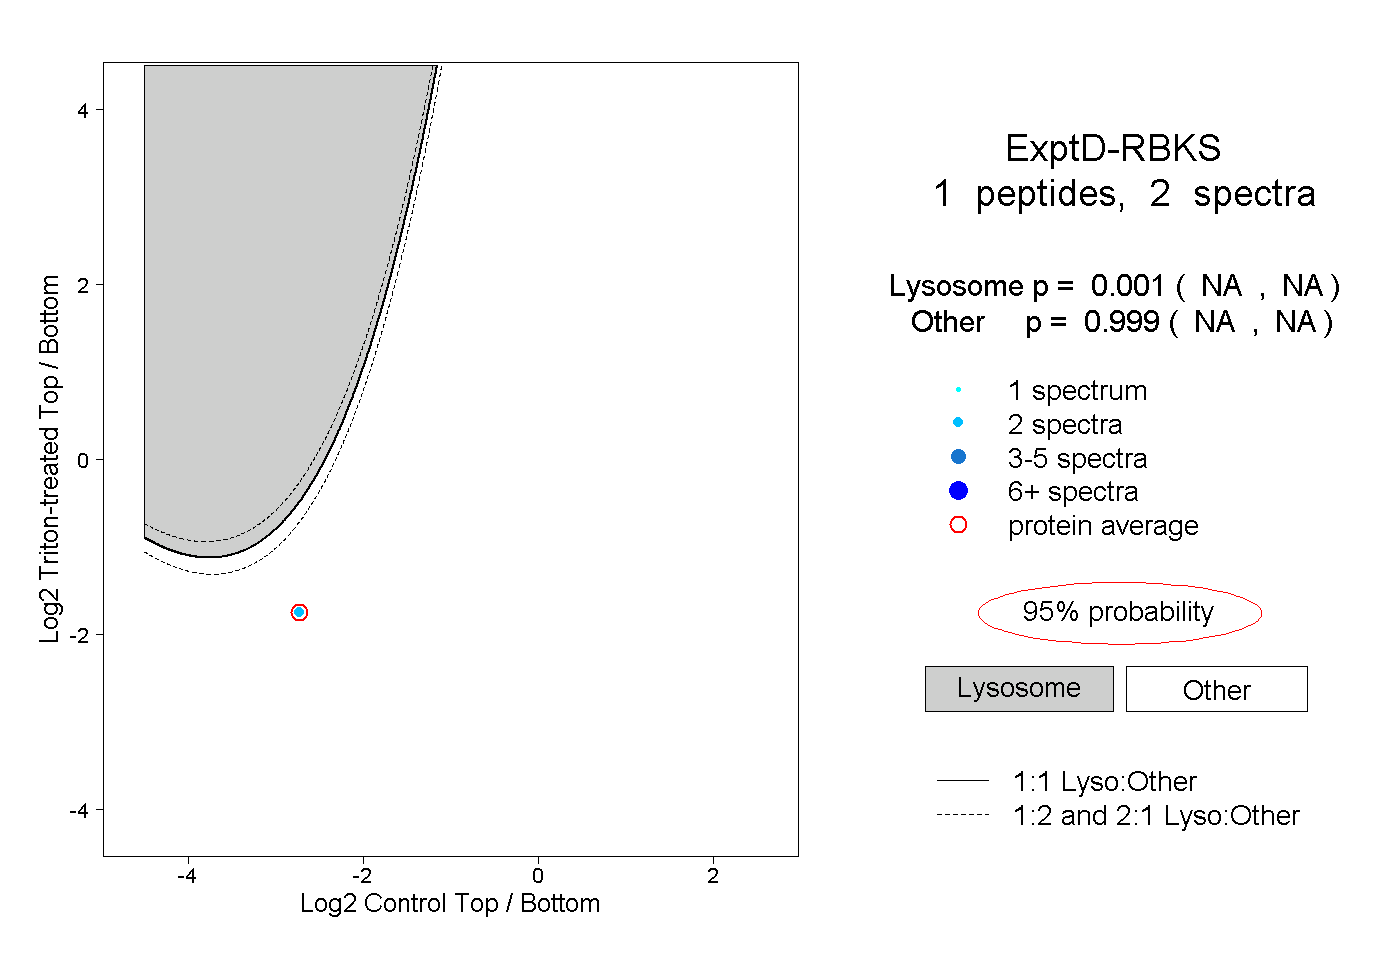 |
0.001 NA | NA |
0.999 NA | NA |