 4
4peptides
spectra
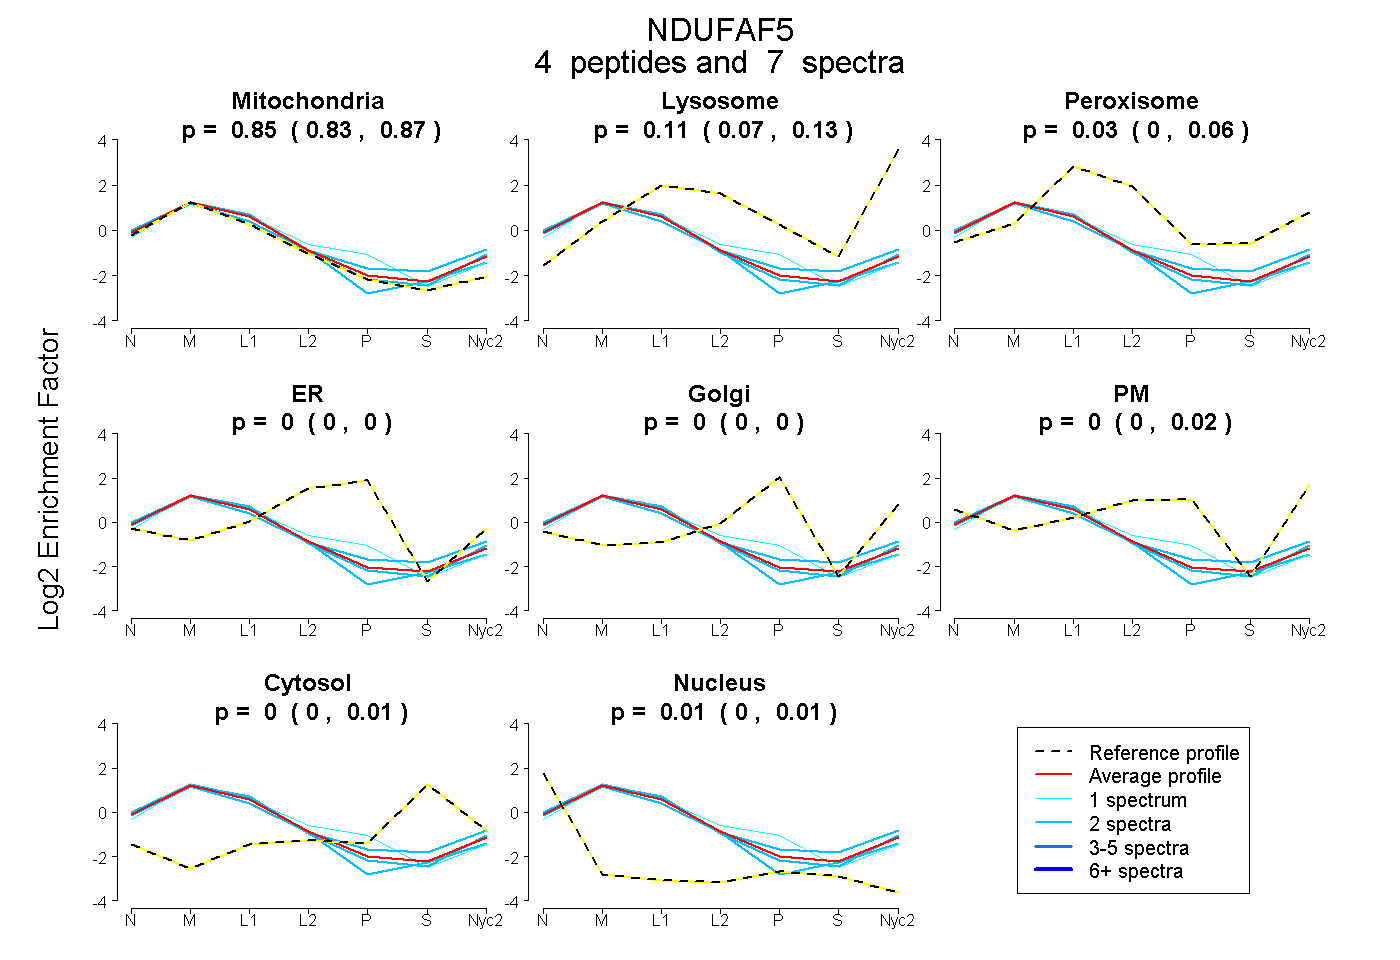
0.830 | 0.870
0.070 | 0.133
0.000 | 0.061
0.000 | 0.000
0.000 | 0.000
0.000 | 0.020
0.000 | 0.013
0.000 | 0.009
2peptides
spectra
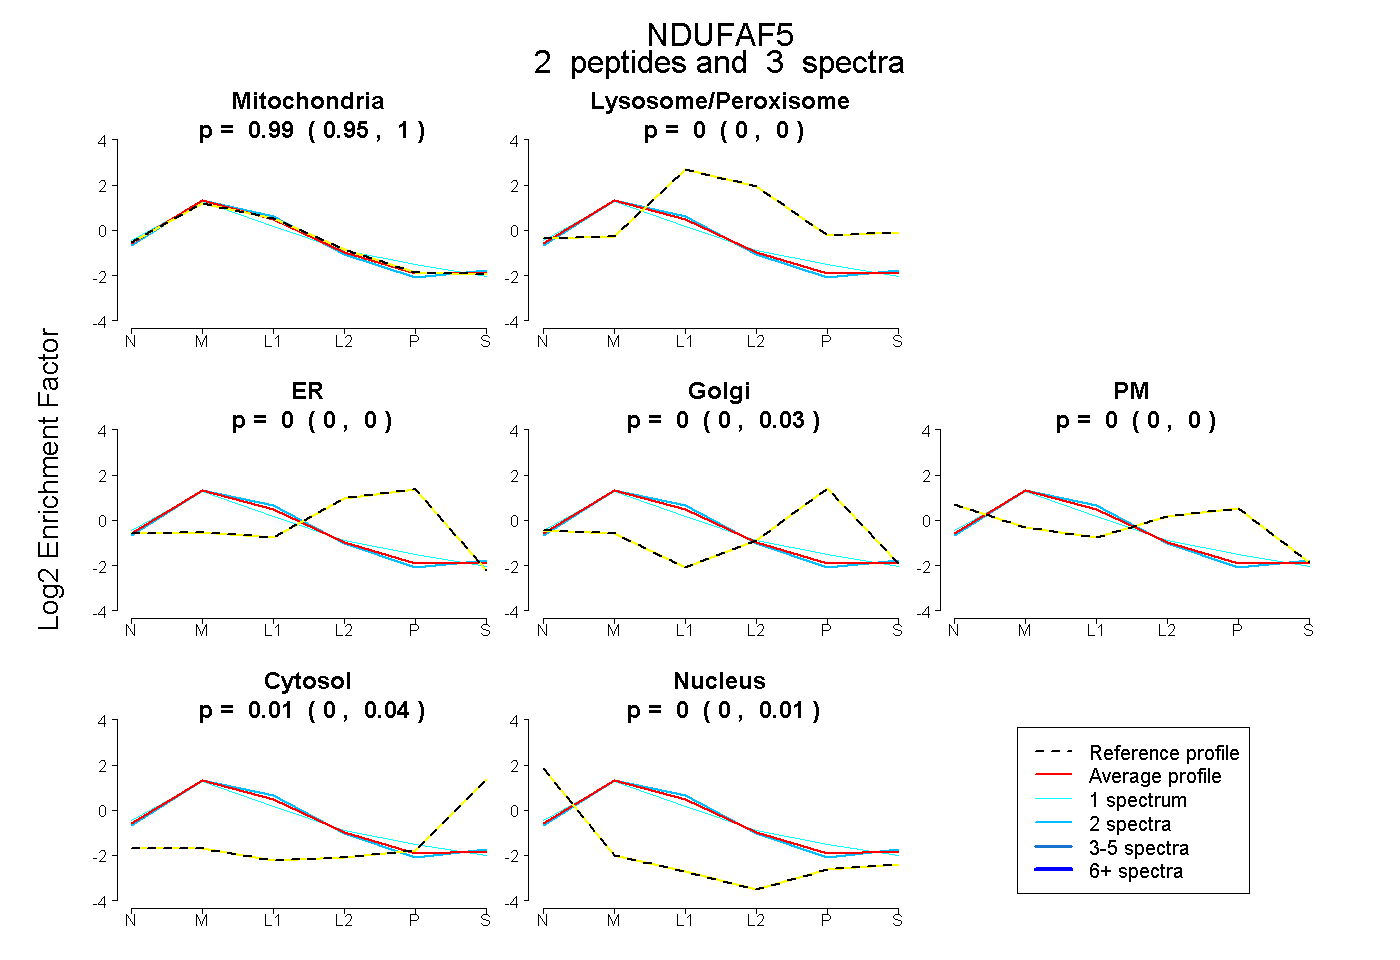
0.947 | 1.000
0.000 | 0.001
0.000 | 0.000
0.000 | 0.031
0.000 | 0.000
0.000 | 0.038
0.000 | 0.013
9peptides
spectra
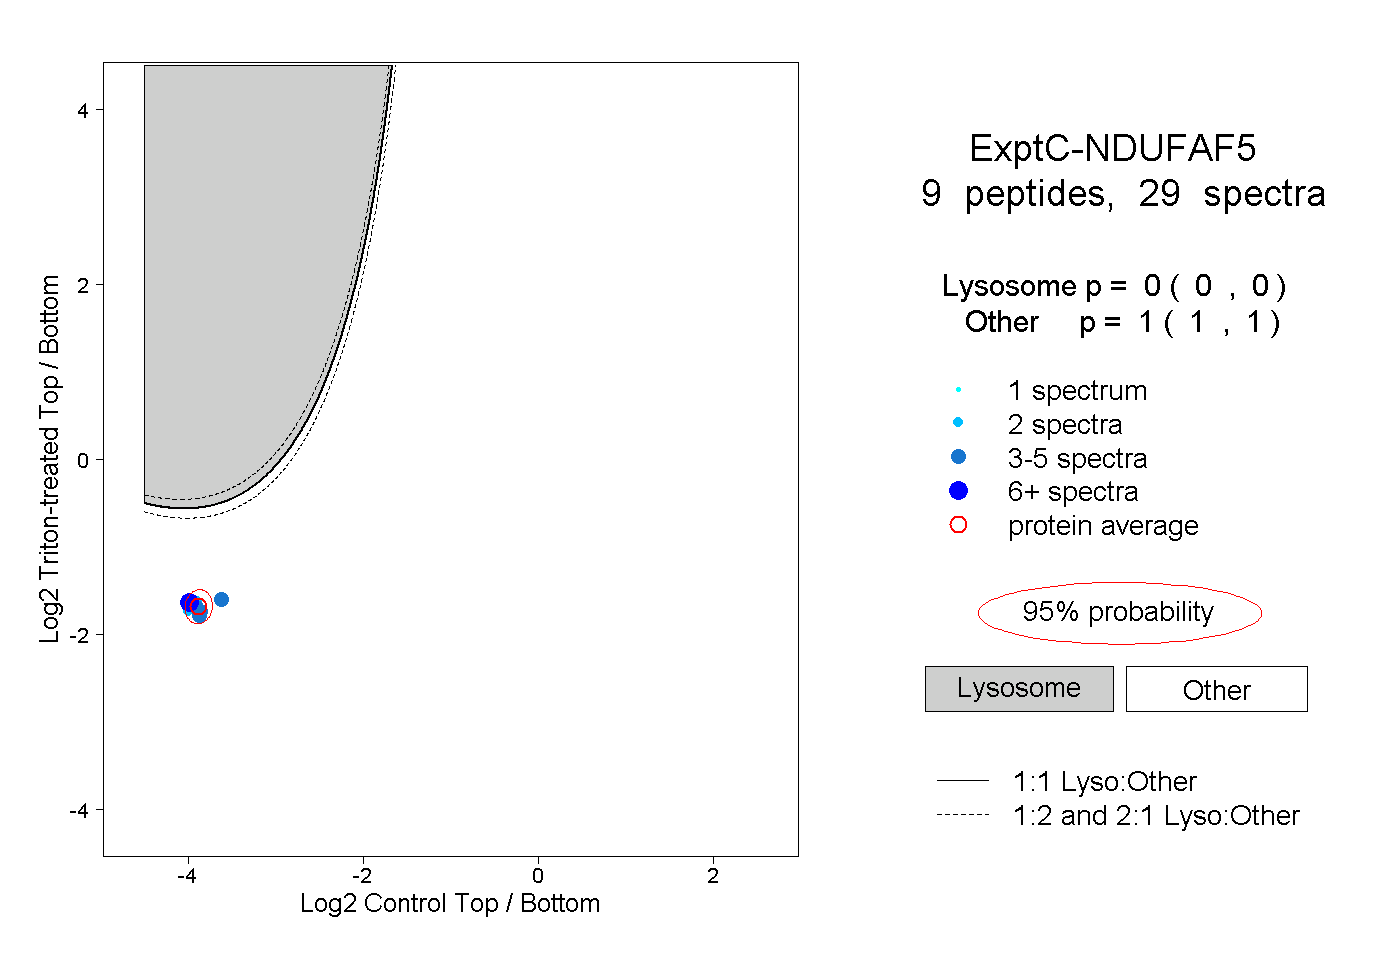
0.000 | 0.000
1.000 | 1.000
1peptide
spectrum
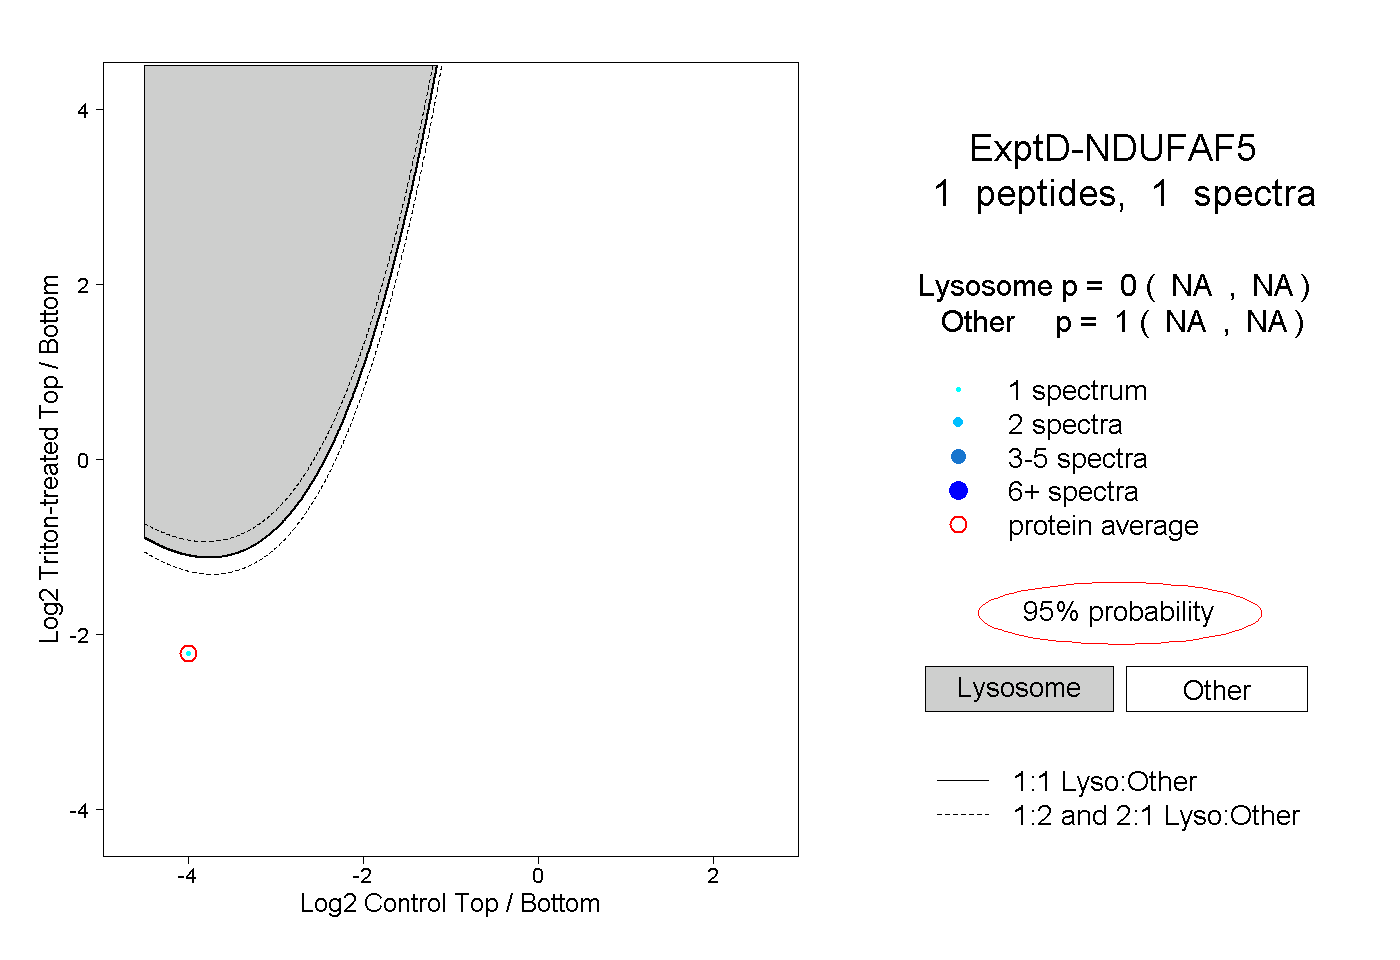
NA | NA
NA | NA