 4
4peptides
spectra
0.830 | 0.870
0.070 | 0.133
0.000 | 0.061
0.000 | 0.000
0.000 | 0.000
0.000 | 0.020
0.000 | 0.013
0.000 | 0.009
| Plot | Mito | Lyso | Perox | ER | Golgi | PM | Cytosol | Nucleus | |||||
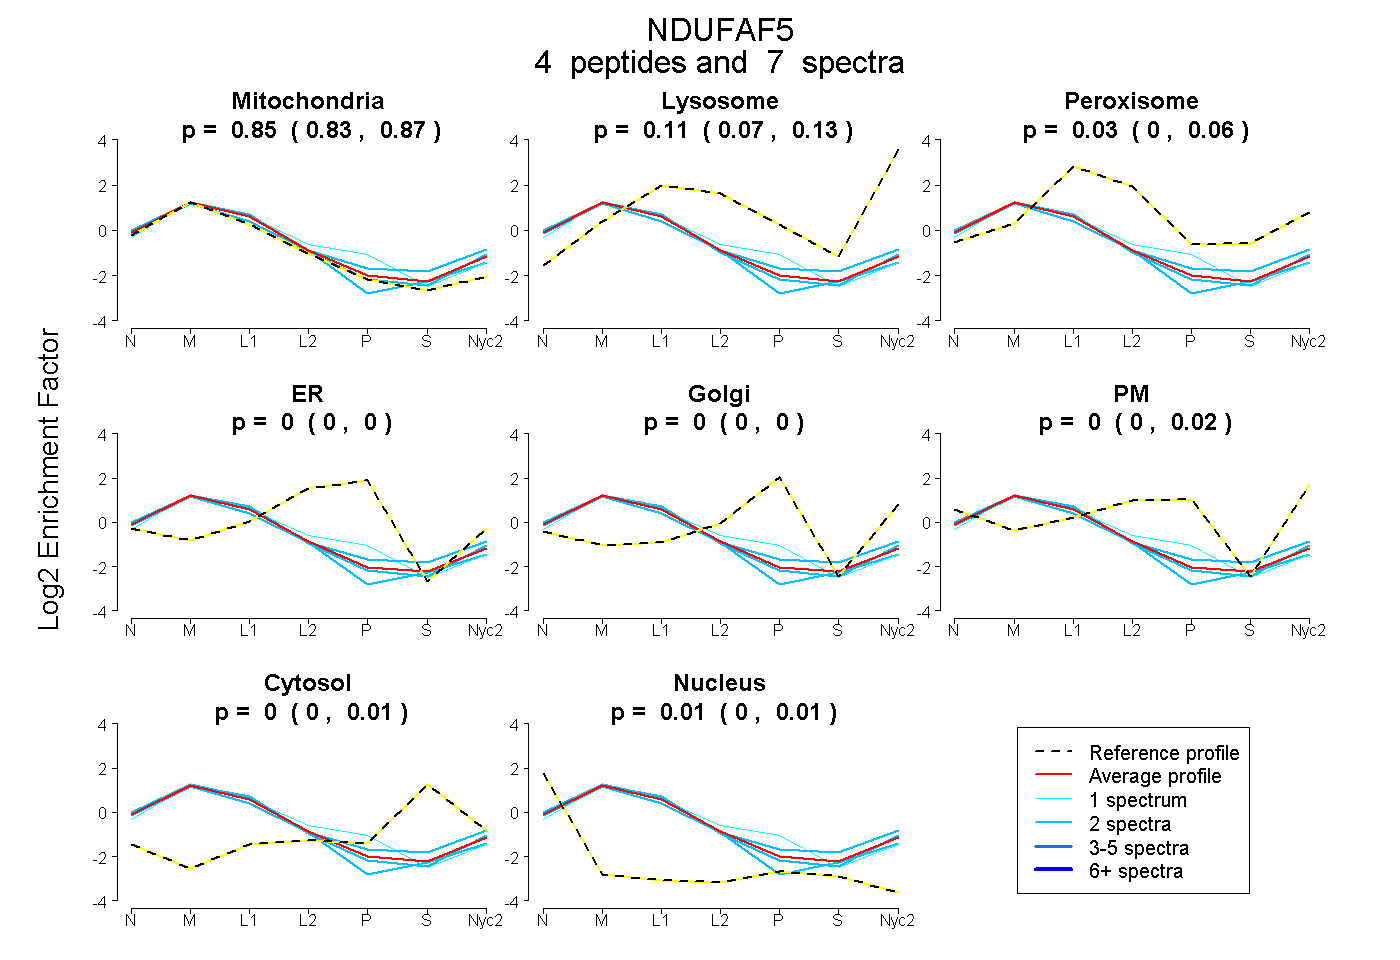
| Expt A |
4 peptides |
7 spectra |
|
0.852 0.830 | 0.870 |
0.109 0.070 | 0.133 |
0.034 0.000 | 0.061 |
0.000 0.000 | 0.000 |
0.000 0.000 | 0.000 |
0.000 0.000 | 0.020 |
0.000 0.000 | 0.013 |
0.006 0.000 | 0.009 |
| 2 spectra, GYIAQHLNK | 0.762 | 0.156 | 0.000 | 0.000 | 0.000 | 0.016 | 0.065 | 0.000 | ||
| 1 spectrum, DTMLAAAAVYR | 0.773 | 0.063 | 0.021 | 0.142 | 0.000 | 0.000 | 0.000 | 0.000 | ||
| 2 spectra, GSATVSFGDLAR | 0.876 | 0.123 | 0.001 | 0.000 | 0.000 | 0.000 | 0.000 | 0.000 | ||
| 2 spectra, ALNIFDR | 0.905 | 0.000 | 0.095 | 0.000 | 0.000 | 0.000 | 0.000 | 0.000 |
| Plot | Mito | Lyso or Perox | ER | Golgi | PM | Cytosol | Nucleus | ||||||
| Expt B |
2 peptides |
3 spectra |
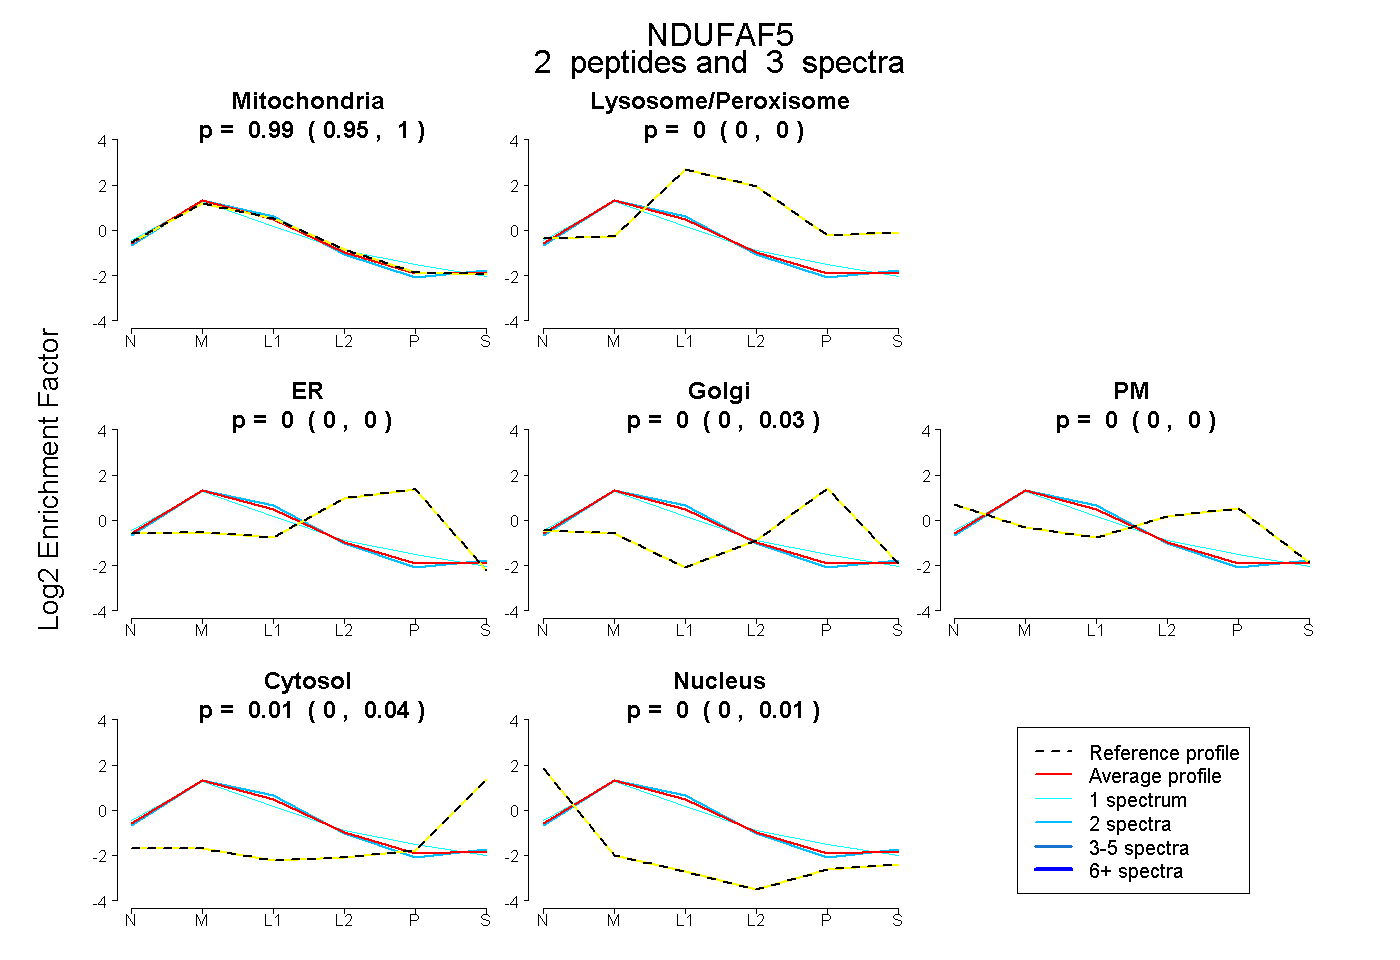 |
0.986 0.947 | 1.000 |
0.000 0.000 | 0.001 |
0.000 0.000 | 0.000 |
0.000 0.000 | 0.031 |
0.000 0.000 | 0.000 |
0.014 0.000 | 0.038 |
0.000 0.000 | 0.013 |
|||
| Plot | Lyso | Other | |||||||||||
| Expt C |
9 peptides |
29 spectra |
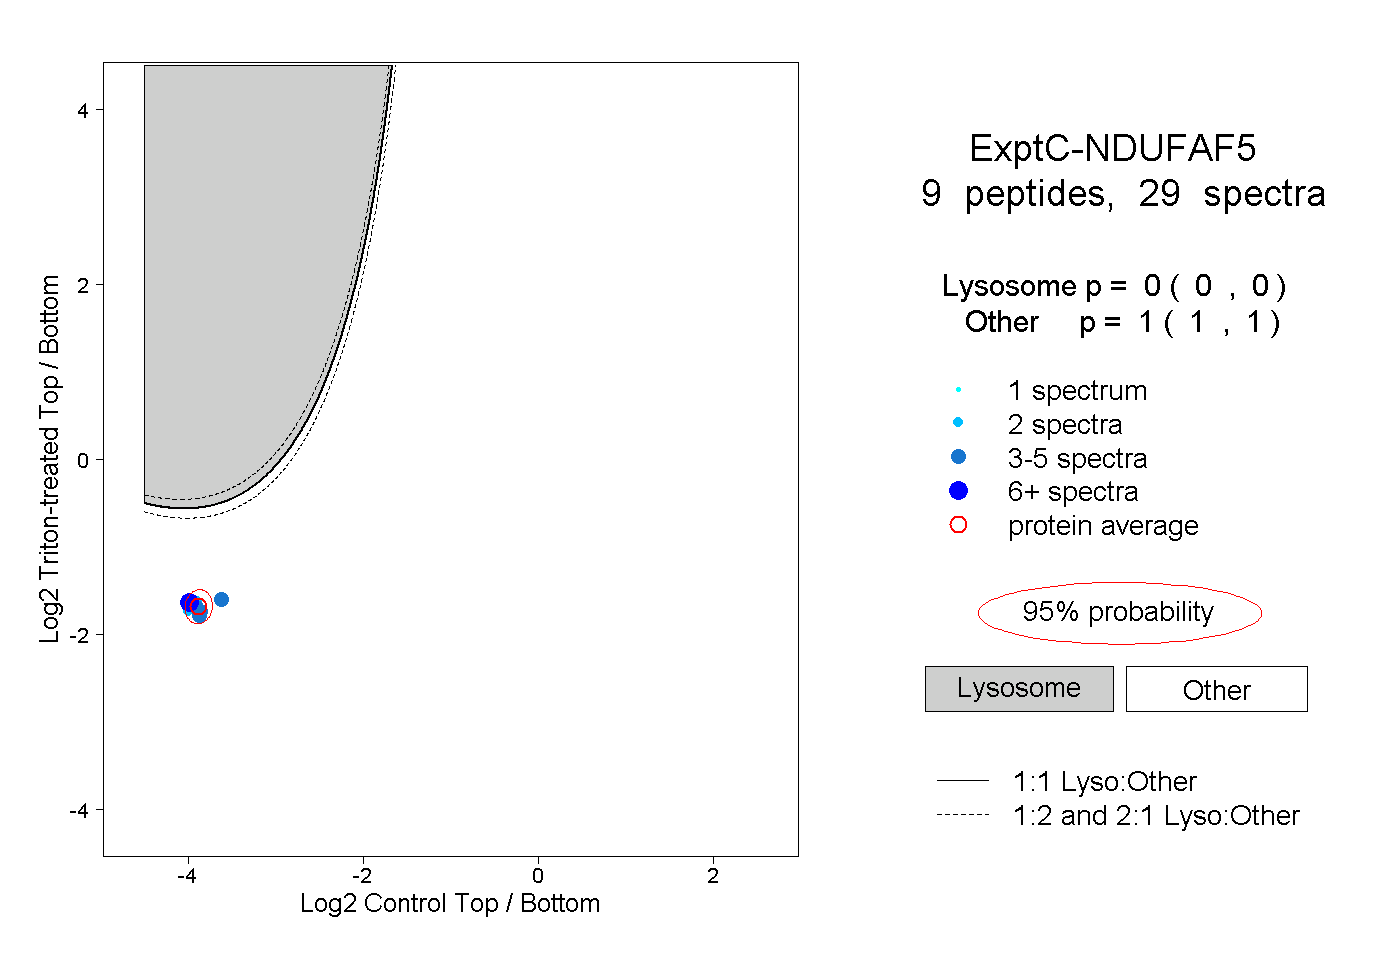 |
0.000 0.000 | 0.000 |
1.000 1.000 | 1.000 |
||||||||
| Plot | Lyso | Other | |||||||||||
| Expt D |
1 peptide |
1 spectrum |
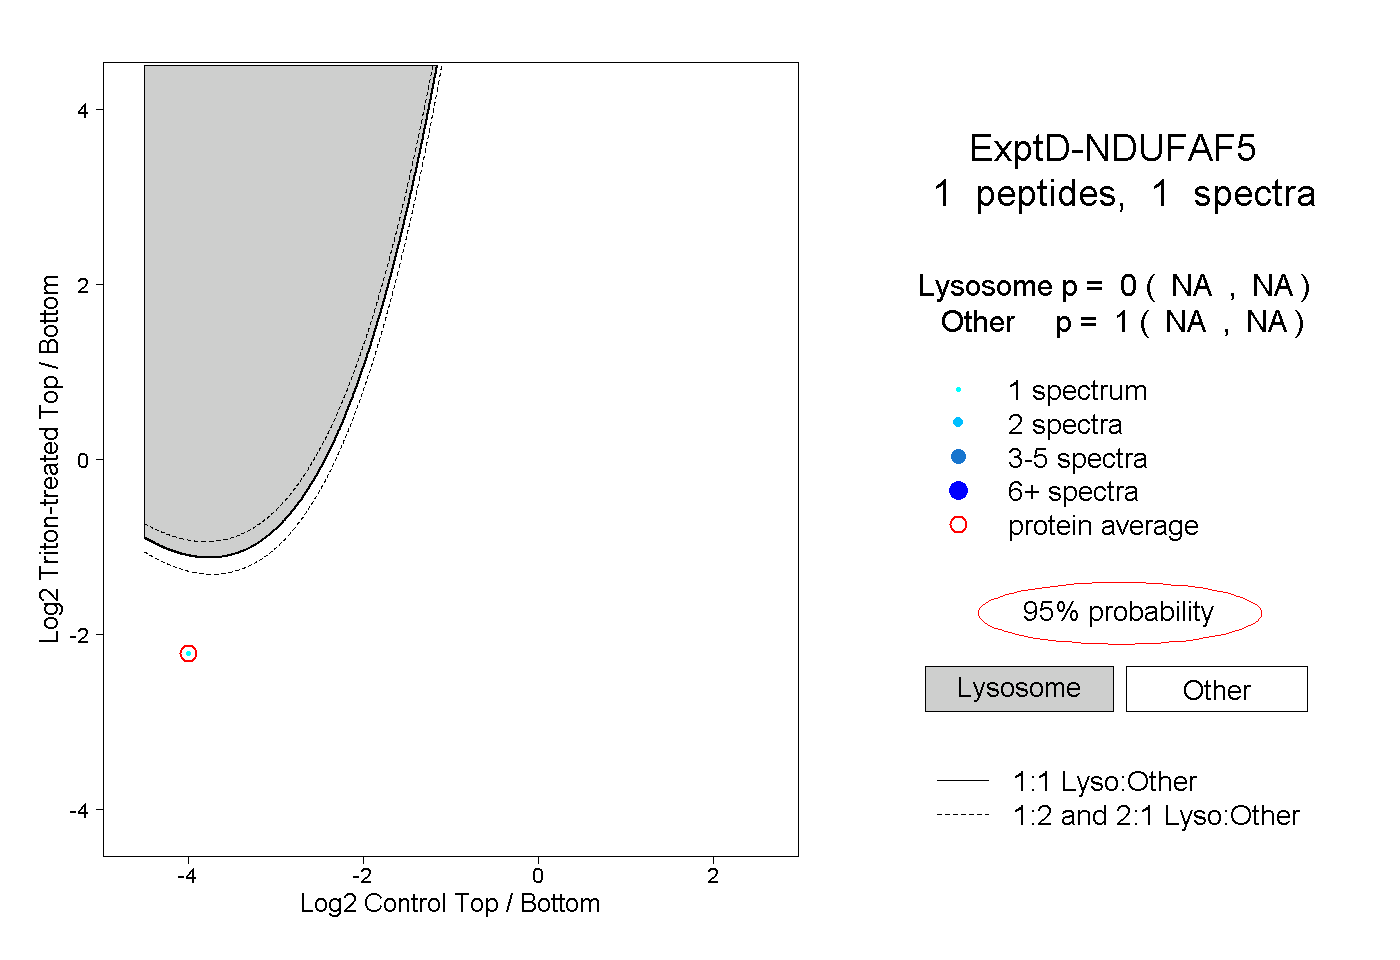 |
0.000 NA | NA |
1.000 NA | NA |