 19
19peptides
spectra
0.000 | 0.000
0.000 | 0.000
0.000 | 0.000
0.334 | 0.372
0.000 | 0.011
0.000 | 0.000
0.483 | 0.509
0.127 | 0.157
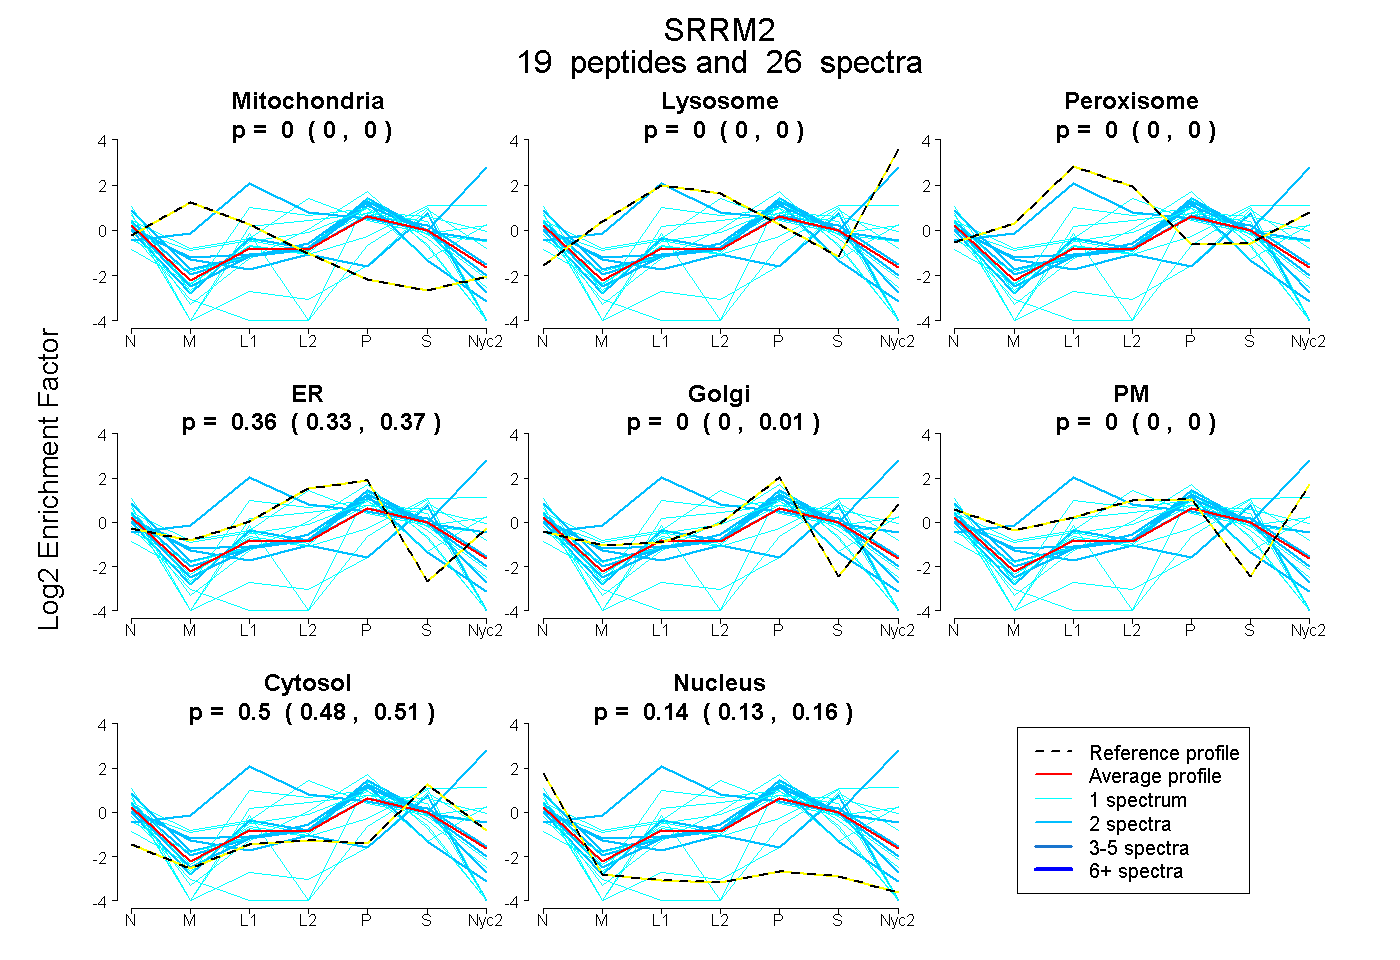
| Plot | Mito | Lyso | Perox | ER | Golgi | PM | Cytosol | Nucleus | |||||
| Expt A |
19 peptides |
26 spectra |
|
0.000 0.000 | 0.000 |
0.000 0.000 | 0.000 |
0.000 0.000 | 0.000 |
0.360 0.334 | 0.372 |
0.000 0.000 | 0.011 |
0.000 0.000 | 0.000 |
0.497 0.483 | 0.509 |
0.143 0.127 | 0.157 |
| 2 spectra, TPLTSR | 0.000 | 0.000 | 0.000 | 0.404 | 0.000 | 0.000 | 0.454 | 0.142 | ||
| 1 spectrum, KPIDSLR | 0.000 | 0.000 | 0.000 | 0.000 | 0.000 | 0.000 | 0.692 | 0.308 | ||
| 2 spectra, SATPPATR | 0.000 | 0.000 | 0.000 | 0.514 | 0.000 | 0.000 | 0.103 | 0.383 | ||
| 1 spectrum, TPPVTR | 0.000 | 0.000 | 0.000 | 0.452 | 0.000 | 0.000 | 0.390 | 0.158 | ||
| 1 spectrum, DVNPGGK | 0.000 | 0.000 | 0.000 | 0.030 | 0.500 | 0.000 | 0.423 | 0.046 | ||
| 2 spectra, ILLPNSSQDELMEVEK | 0.000 | 0.000 | 0.000 | 0.399 | 0.000 | 0.000 | 0.446 | 0.155 | ||
| 1 spectrum, LGLIEEDVASSCVLR | 0.000 | 0.000 | 0.000 | 0.009 | 0.159 | 0.000 | 0.312 | 0.520 | ||
| 1 spectrum, GQSQTWPDTSSPEVR | 0.000 | 0.000 | 0.190 | 0.217 | 0.000 | 0.293 | 0.300 | 0.000 | ||
| 2 spectra, KPPPGER | 0.176 | 0.000 | 0.000 | 0.000 | 0.000 | 0.000 | 0.533 | 0.290 | ||
| 1 spectrum, MSQVPAPVPLMSLR | 0.000 | 0.000 | 0.000 | 0.351 | 0.000 | 0.000 | 0.465 | 0.184 | ||
| 2 spectra, RPNPDILDHER | 0.000 | 0.000 | 0.000 | 0.313 | 0.043 | 0.000 | 0.502 | 0.141 | ||
| 1 spectrum, SIAQTTPVAGSQSLSSGTVAK | 0.000 | 0.000 | 0.000 | 0.000 | 0.000 | 0.000 | 0.480 | 0.520 | ||
| 2 spectra, TPLLSR | 0.000 | 0.650 | 0.177 | 0.000 | 0.000 | 0.051 | 0.121 | 0.000 | ||
| 1 spectrum, TPAASAVNLAGAR | 0.000 | 0.000 | 0.121 | 0.295 | 0.000 | 0.352 | 0.169 | 0.064 | ||
| 1 spectrum, ALPQTPR | 0.076 | 0.000 | 0.000 | 0.453 | 0.000 | 0.000 | 0.335 | 0.136 | ||
| 1 spectrum, SSSELSPEIVEK | 0.000 | 0.209 | 0.000 | 0.000 | 0.080 | 0.000 | 0.712 | 0.000 | ||
| 1 spectrum, SSVEPK | 0.000 | 0.000 | 0.011 | 0.000 | 0.397 | 0.025 | 0.567 | 0.000 | ||
| 1 spectrum, TPLLPR | 0.000 | 0.000 | 0.000 | 0.465 | 0.000 | 0.000 | 0.219 | 0.316 | ||
| 2 spectra, STTPAPK | 0.000 | 0.000 | 0.000 | 0.049 | 0.498 | 0.000 | 0.435 | 0.019 |
| Plot | Mito | Lyso or Perox | ER | Golgi | PM | Cytosol | Nucleus | ||||||
| Expt B |
4 peptides |
8 spectra |
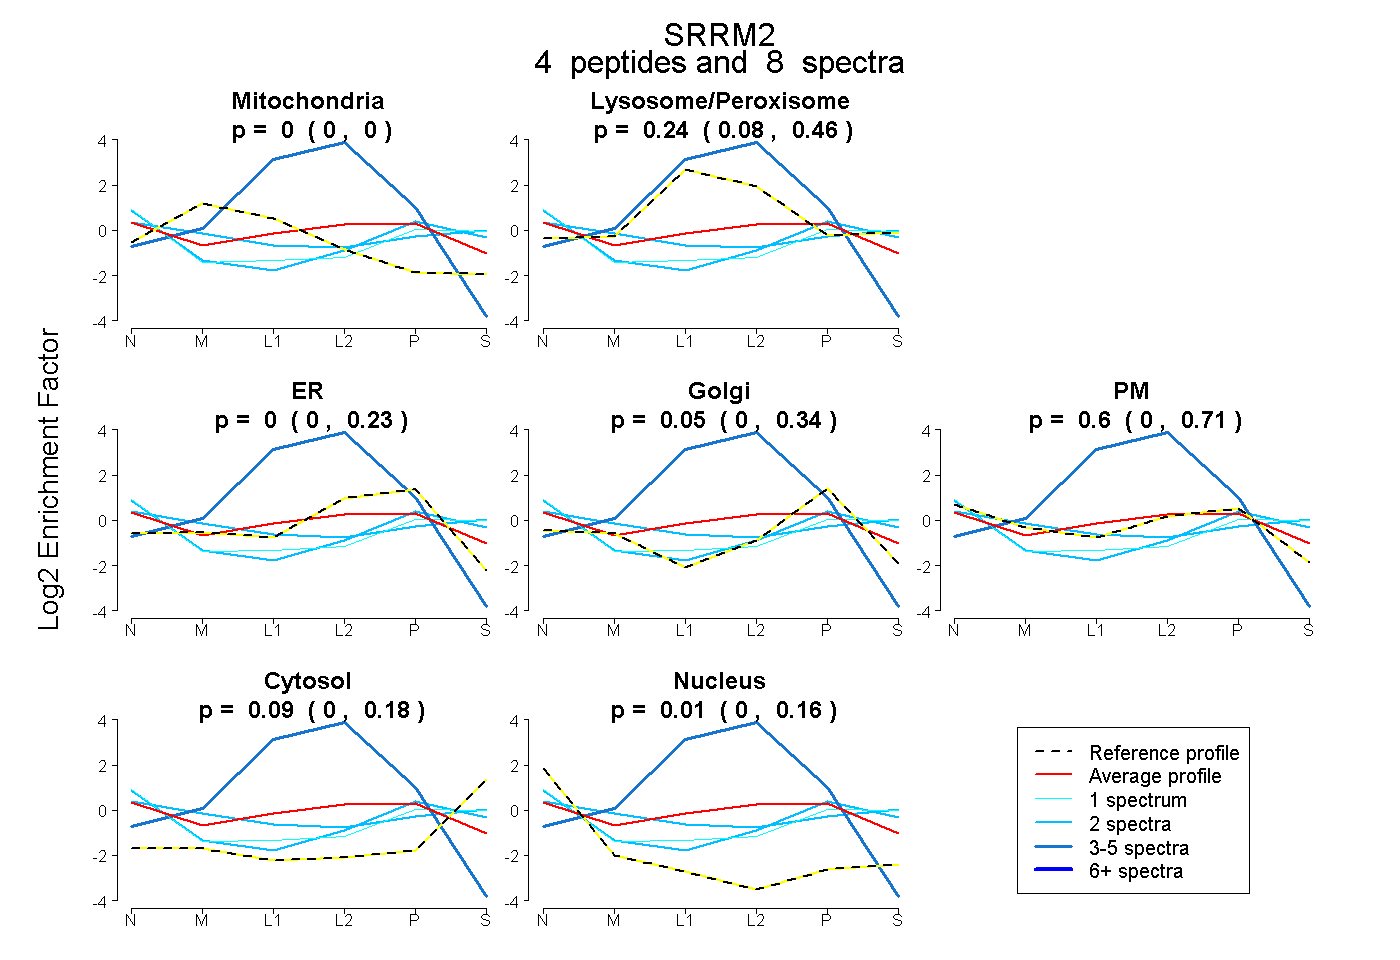 |
0.000 0.000 | 0.000 |
0.240 0.081 | 0.462 |
0.000 0.000 | 0.231 |
0.053 0.000 | 0.339 |
0.601 0.000 | 0.705 |
0.091 0.000 | 0.179 |
0.014 0.000 | 0.164 |
|||
| Plot | Lyso | Other | |||||||||||
| Expt C |
5 peptides |
6 spectra |
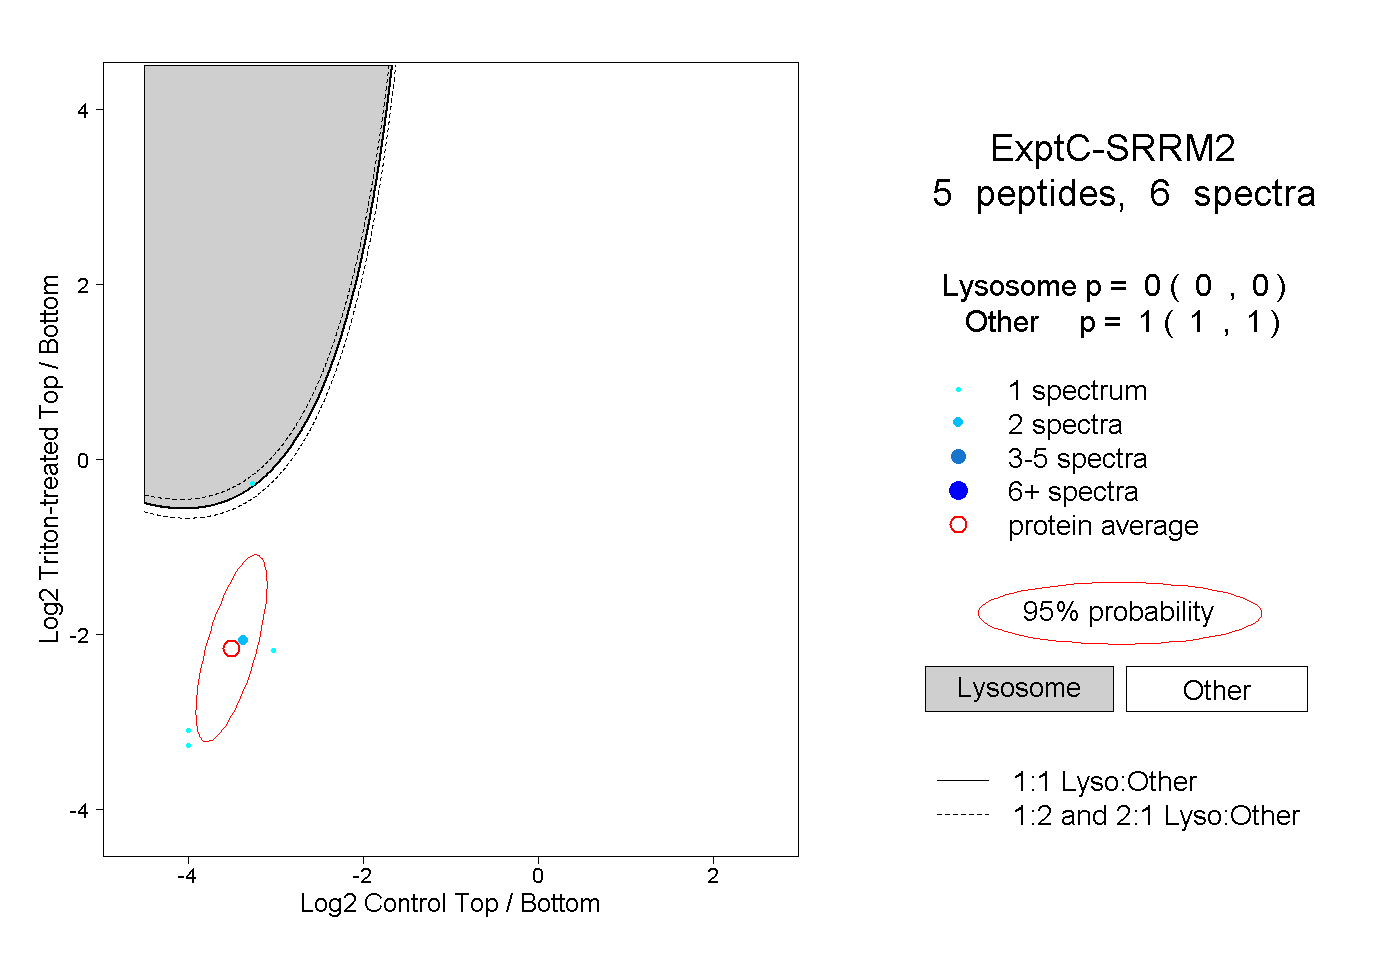 |
0.000 0.000 | 0.000 |
1.000 1.000 | 1.000 |