 4
4peptides
spectra
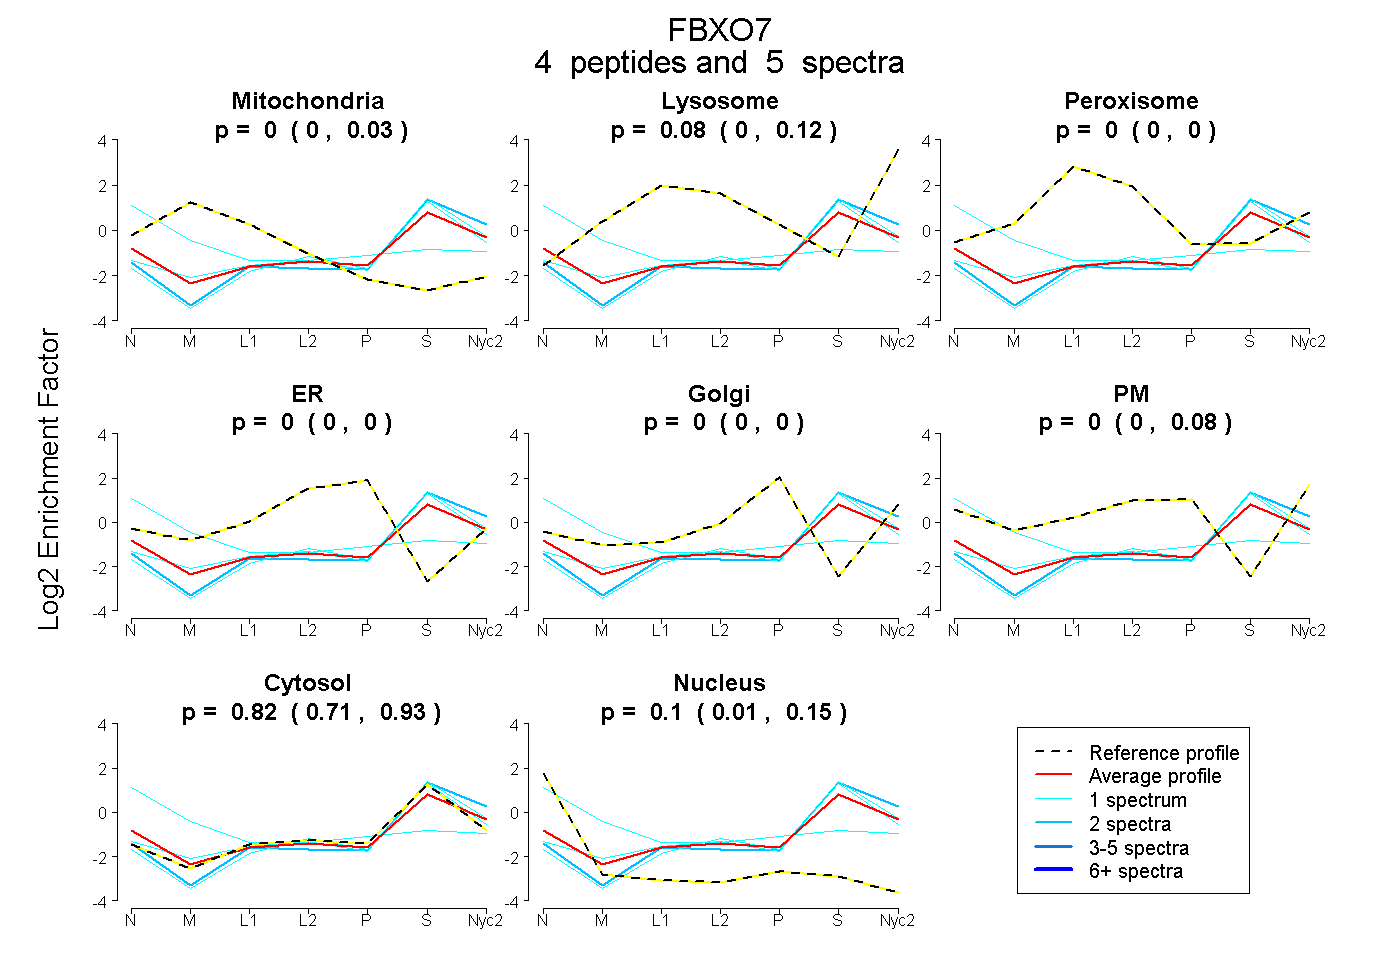
0.000 | 0.026
0.000 | 0.117
0.000 | 0.000
0.000 | 0.000
0.000 | 0.000
0.000 | 0.082
0.713 | 0.930
0.011 | 0.149
| Plot | Mito | Lyso | Perox | ER | Golgi | PM | Cytosol | Nucleus | |||||
| Expt A |
4 peptides |
5 spectra |
|
0.000 0.000 | 0.026 |
0.077 0.000 | 0.117 |
0.000 0.000 | 0.000 |
0.000 0.000 | 0.000 |
0.000 0.000 | 0.000 |
0.000 0.000 | 0.082 |
0.824 0.713 | 0.930 |
0.099 0.011 | 0.149 |
| 1 spectrum, TQPLEVPESEPTLGQLR | 0.000 | 0.000 | 0.000 | 0.000 | 0.000 | 0.000 | 1.000 | 0.000 | ||
| 1 spectrum, FAITLNNK | 0.032 | 0.012 | 0.000 | 0.000 | 0.000 | 0.000 | 0.955 | 0.000 | ||
| 1 spectrum, VNGGIK | 0.216 | 0.000 | 0.000 | 0.000 | 0.000 | 0.275 | 0.263 | 0.247 | ||
| 2 spectra, DQLVYPLLAFTR | 0.000 | 0.000 | 0.000 | 0.000 | 0.000 | 0.000 | 1.000 | 0.000 |
| Plot | Lyso | Other | |||||||||||
| Expt C |
3 peptides |
10 spectra |
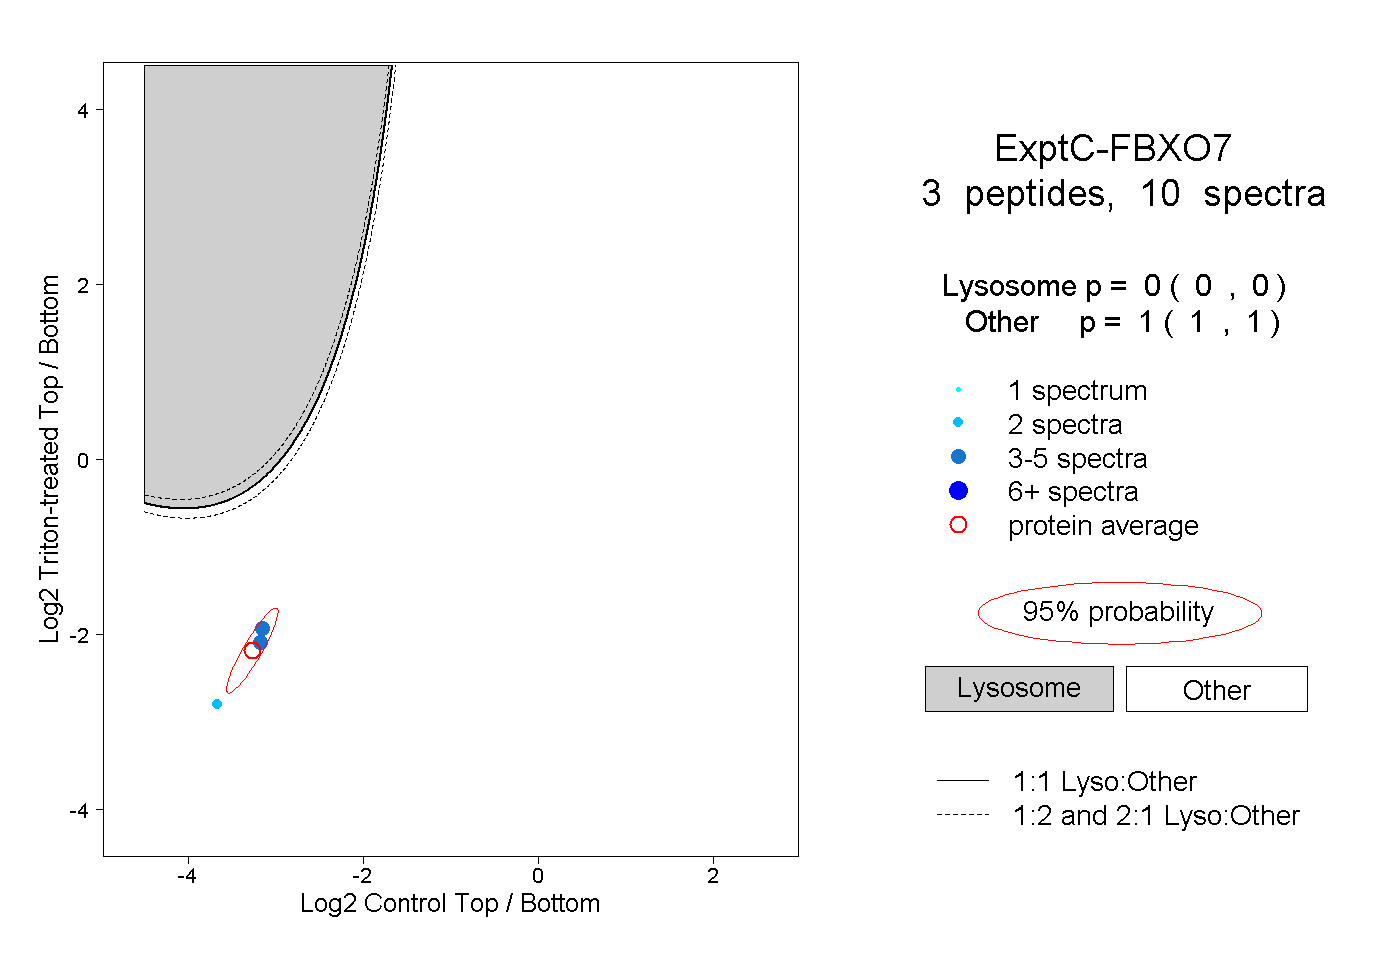 |
0.000 0.000 | 0.000 |
1.000 1.000 | 1.000 |