 6
6peptides
spectra
0.000 | 0.000
0.000 | 0.000
0.002 | 0.035
0.962 | 0.994
0.000 | 0.000
0.000 | 0.000
0.000 | 0.000
0.000 | 0.000
2peptides
spectra
NA | NA
NA | NA
NA | NA
NA | NA
NA | NA
NA | NA
NA | NA
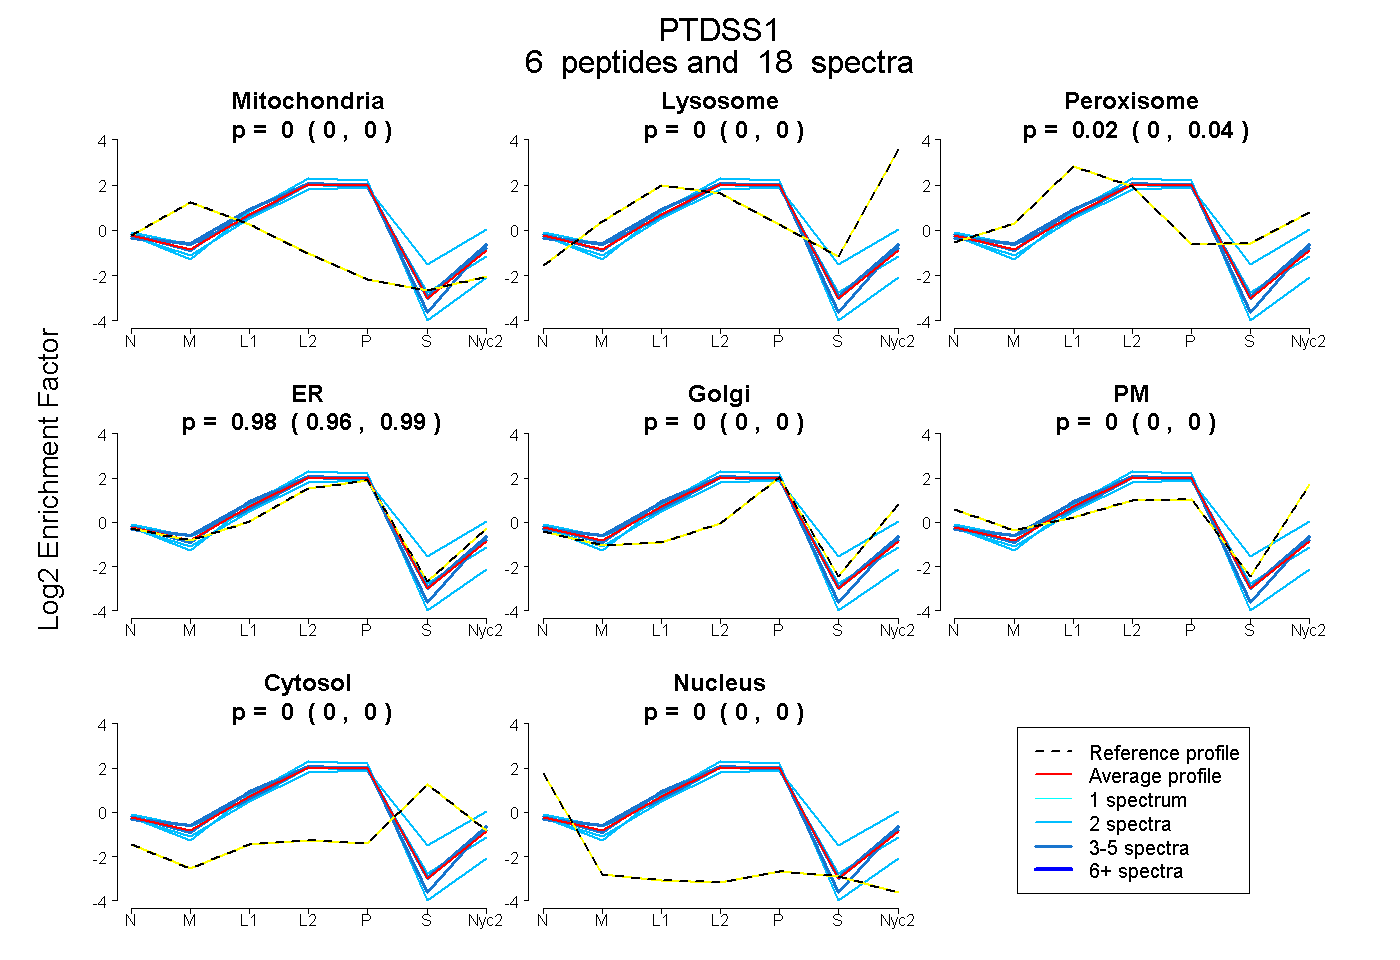
| Plot | Mito | Lyso | Perox | ER | Golgi | PM | Cytosol | Nucleus | |||||
| Expt A |
6 peptides |
18 spectra |
|
0.000 0.000 | 0.000 |
0.000 0.000 | 0.000 |
0.020 0.002 | 0.035 |
0.980 0.962 | 0.994 |
0.000 0.000 | 0.000 |
0.000 0.000 | 0.000 |
0.000 0.000 | 0.000 |
0.000 0.000 | 0.000 |
||
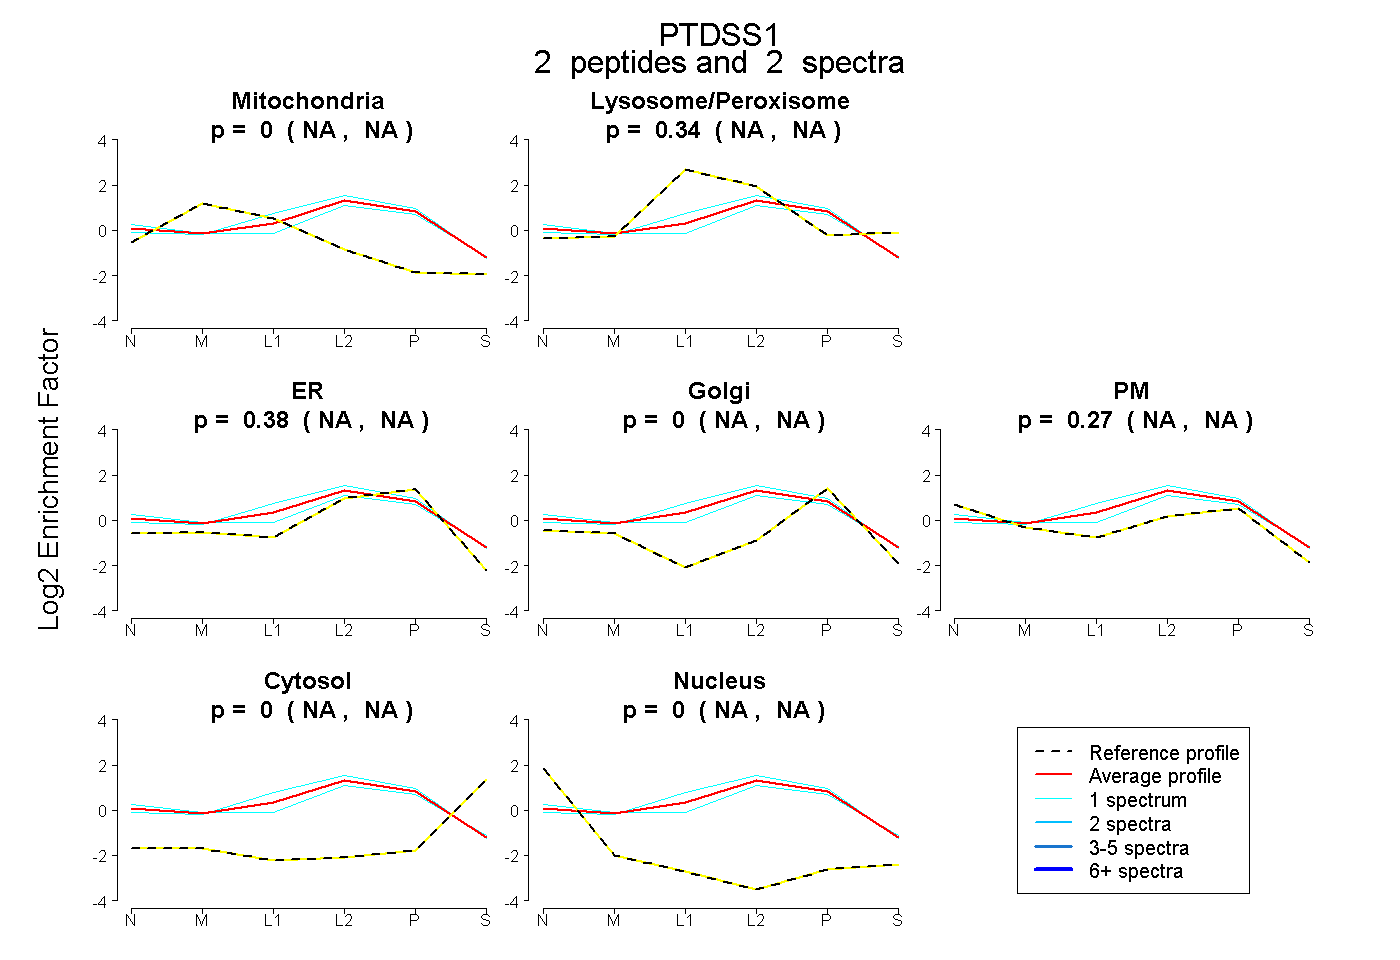
| Plot | Mito | Lyso or Perox | ER | Golgi | PM | Cytosol | Nucleus | ||||||
| Expt B |
2 peptides |
2 spectra |
|
0.000 NA | NA |
0.345 NA | NA |
0.381 NA | NA |
0.000 NA | NA |
0.274 NA | NA |
0.000 NA | NA |
0.000 NA | NA |
| 1 spectrum, DDVNYR | 0.000 | 0.428 | 0.506 | 0.000 | 0.066 | 0.000 | 0.000 | |||
| 1 spectrum, GSEDSPPK | 0.000 | 0.261 | 0.256 | 0.000 | 0.483 | 0.000 | 0.000 |
| Plot | Lyso | Other | |||||||||||
| Expt C |
5 peptides |
19 spectra |
 |
0.000 0.000 | 0.000 |
1.000 1.000 | 1.000 |