 7
7peptides
spectra
0.000 | 0.000
0.014 | 0.089
0.000 | 0.085
0.013 | 0.135
0.000 | 0.066
0.076 | 0.194
0.631 | 0.689
0.000 | 0.000
1peptide
spectrum
NA | NA
NA | NA
NA | NA
NA | NA
NA | NA
NA | NA
NA | NA
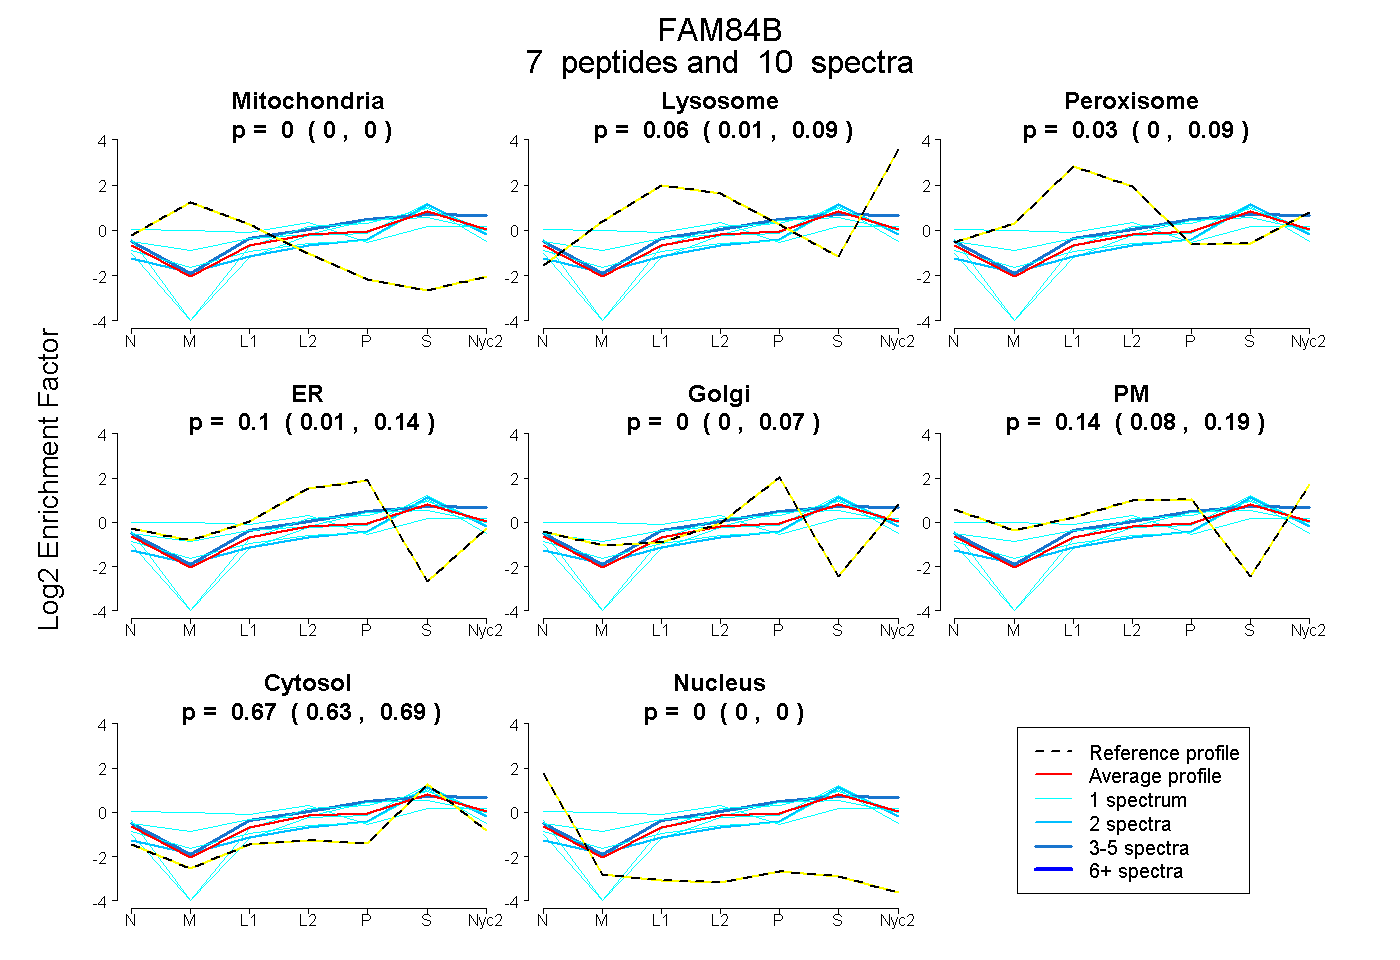
| Plot | Mito | Lyso | Perox | ER | Golgi | PM | Cytosol | Nucleus | |||||
| Expt A |
7 peptides |
10 spectra |
|
0.000 0.000 | 0.000 |
0.060 0.014 | 0.089 |
0.030 0.000 | 0.085 |
0.096 0.013 | 0.135 |
0.000 0.000 | 0.066 |
0.145 0.076 | 0.194 |
0.669 0.631 | 0.689 |
0.000 0.000 | 0.000 |
||
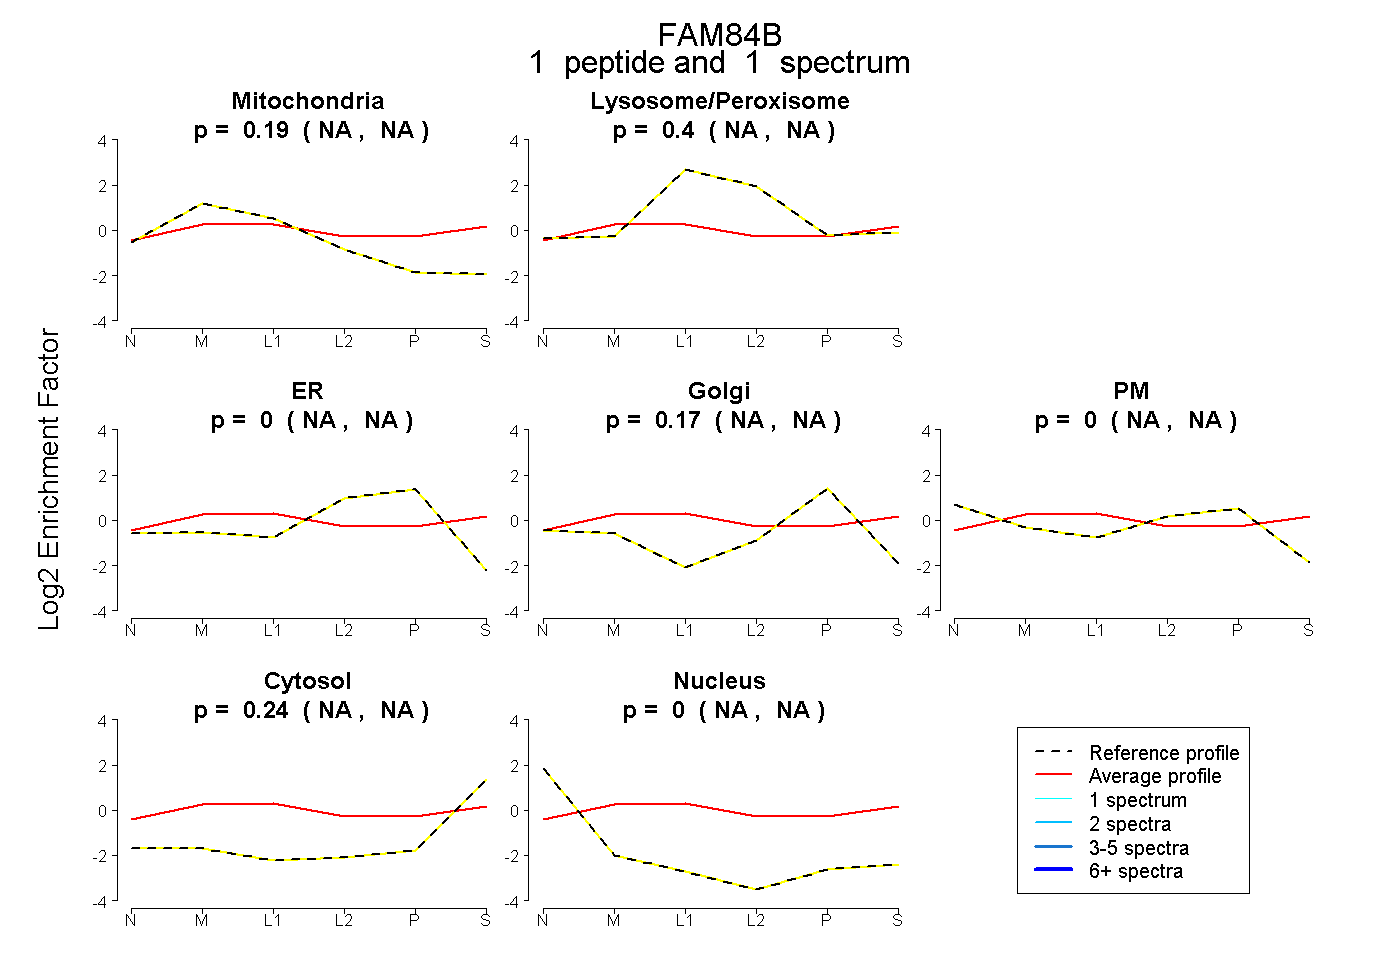
| Plot | Mito | Lyso or Perox | ER | Golgi | PM | Cytosol | Nucleus | ||||||
| Expt B |
1 peptide |
1 spectrum |
|
0.188 NA | NA |
0.400 NA | NA |
0.000 NA | NA |
0.175 NA | NA |
0.000 NA | NA |
0.237 NA | NA |
0.000 NA | NA |
| 1 spectrum, LEVSNSFLTDASQGR | 0.188 | 0.400 | 0.000 | 0.175 | 0.000 | 0.237 | 0.000 |
| Plot | Lyso | Other | |||||||||||
| Expt C |
4 peptides |
10 spectra |
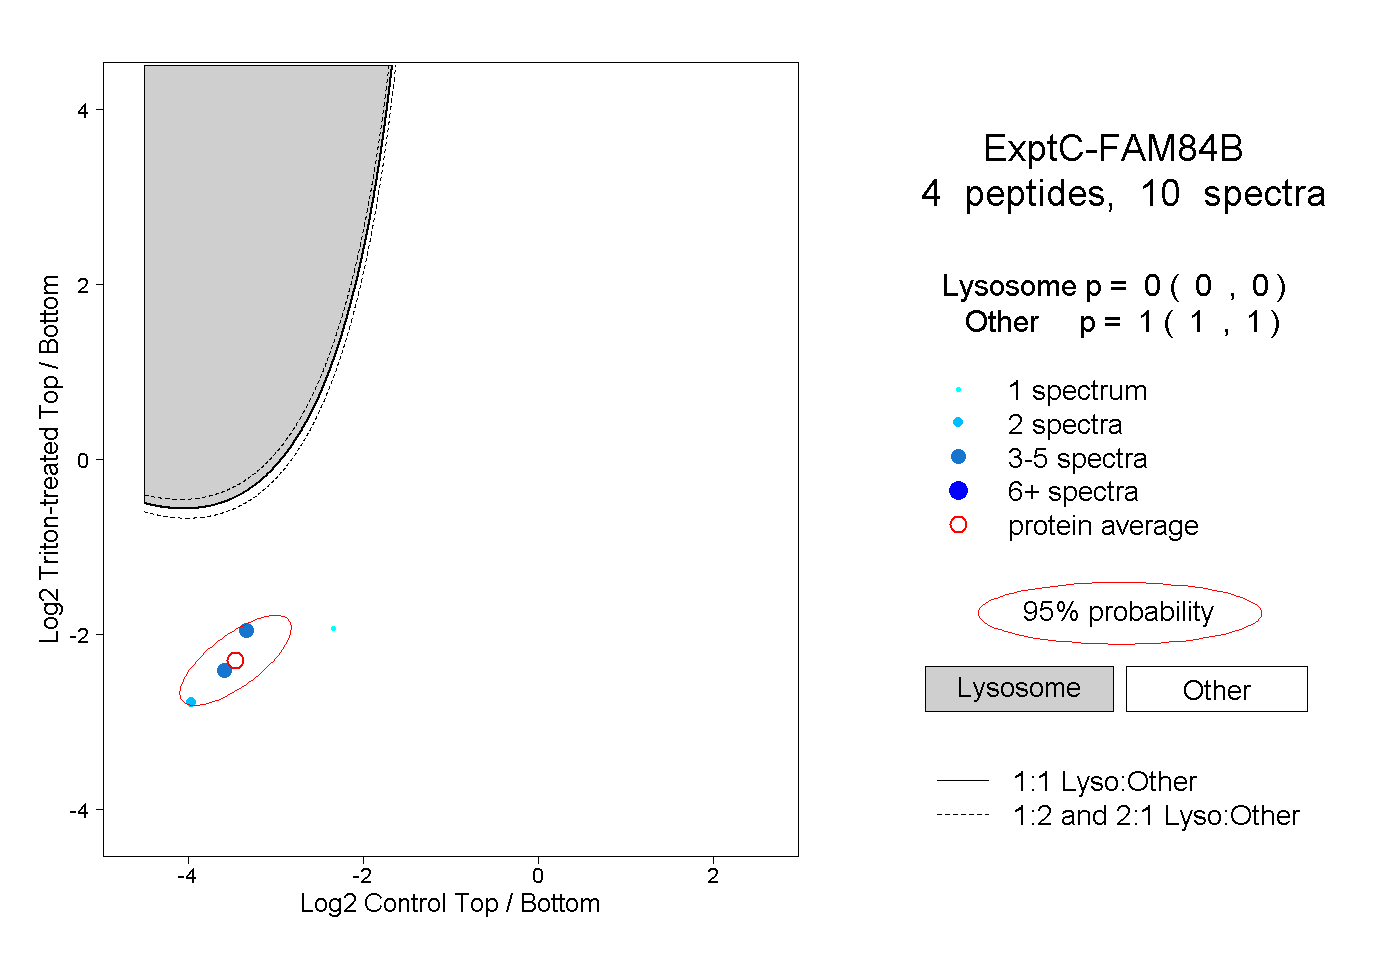 |
0.000 0.000 | 0.000 |
1.000 1.000 | 1.000 |