 1
1peptide
spectra
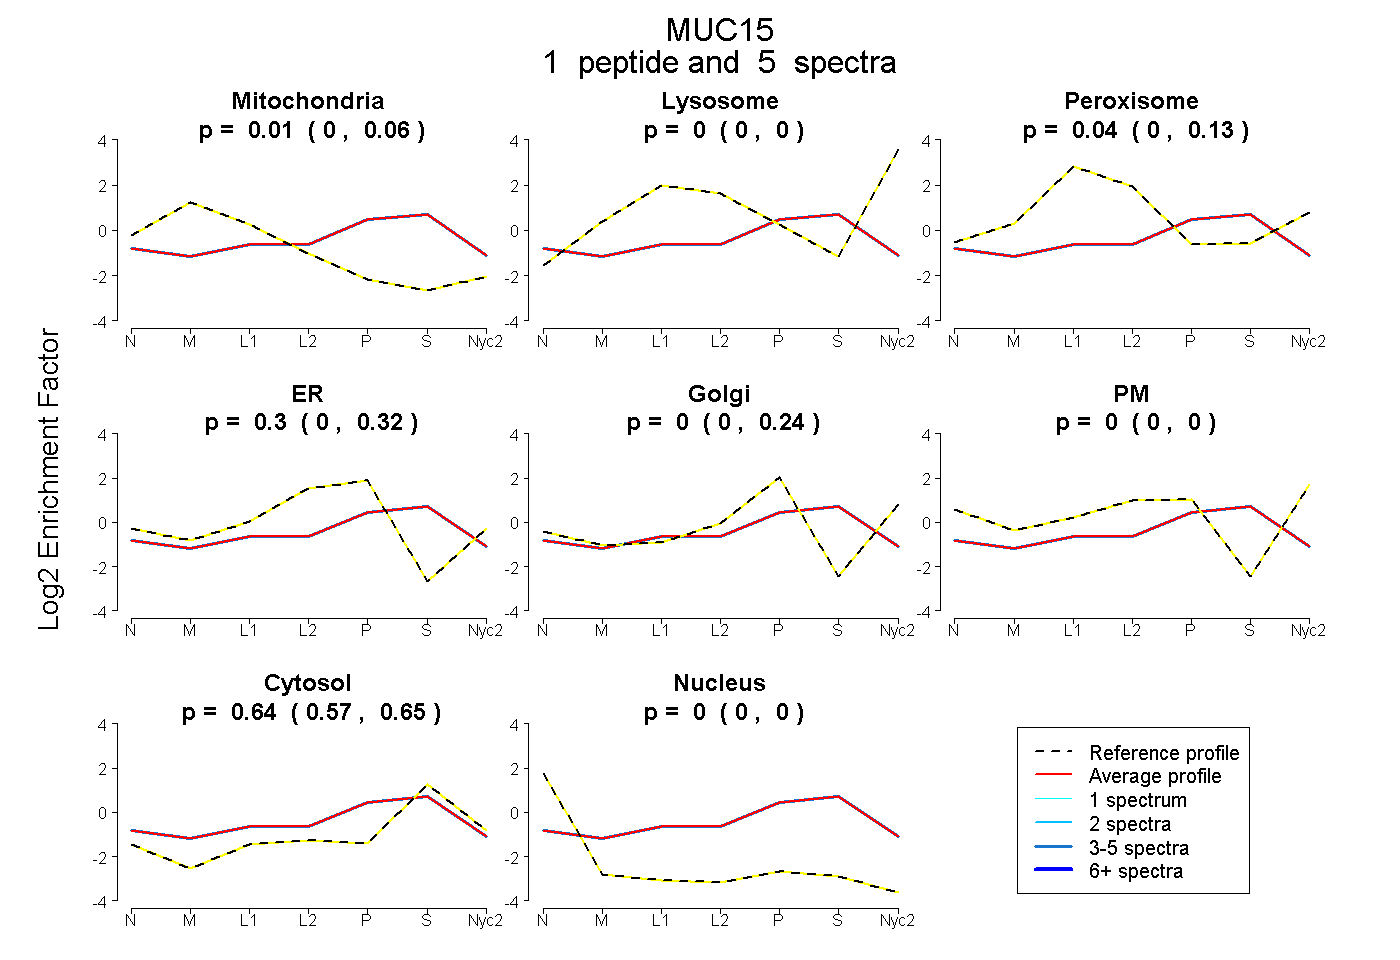
0.000 | 0.058
0.000 | 0.000
0.000 | 0.125
0.000 | 0.317
0.000 | 0.241
0.000 | 0.000
0.573 | 0.650
0.000 | 0.000
| Plot | Mito | Lyso | Perox | ER | Golgi | PM | Cytosol | Nucleus | |||||
| Expt A |
1 peptide |
5 spectra |
|
0.009 0.000 | 0.058 |
0.000 0.000 | 0.000 |
0.043 0.000 | 0.125 |
0.302 0.000 | 0.317 |
0.005 0.000 | 0.241 |
0.000 0.000 | 0.000 |
0.642 0.573 | 0.650 |
0.000 0.000 | 0.000 |
| 5 spectra, LTLAK | 0.009 | 0.000 | 0.043 | 0.302 | 0.005 | 0.000 | 0.642 | 0.000 |
| Plot | Lyso | Other | |||||||||||
| Expt C |
1 peptide |
43 spectra |
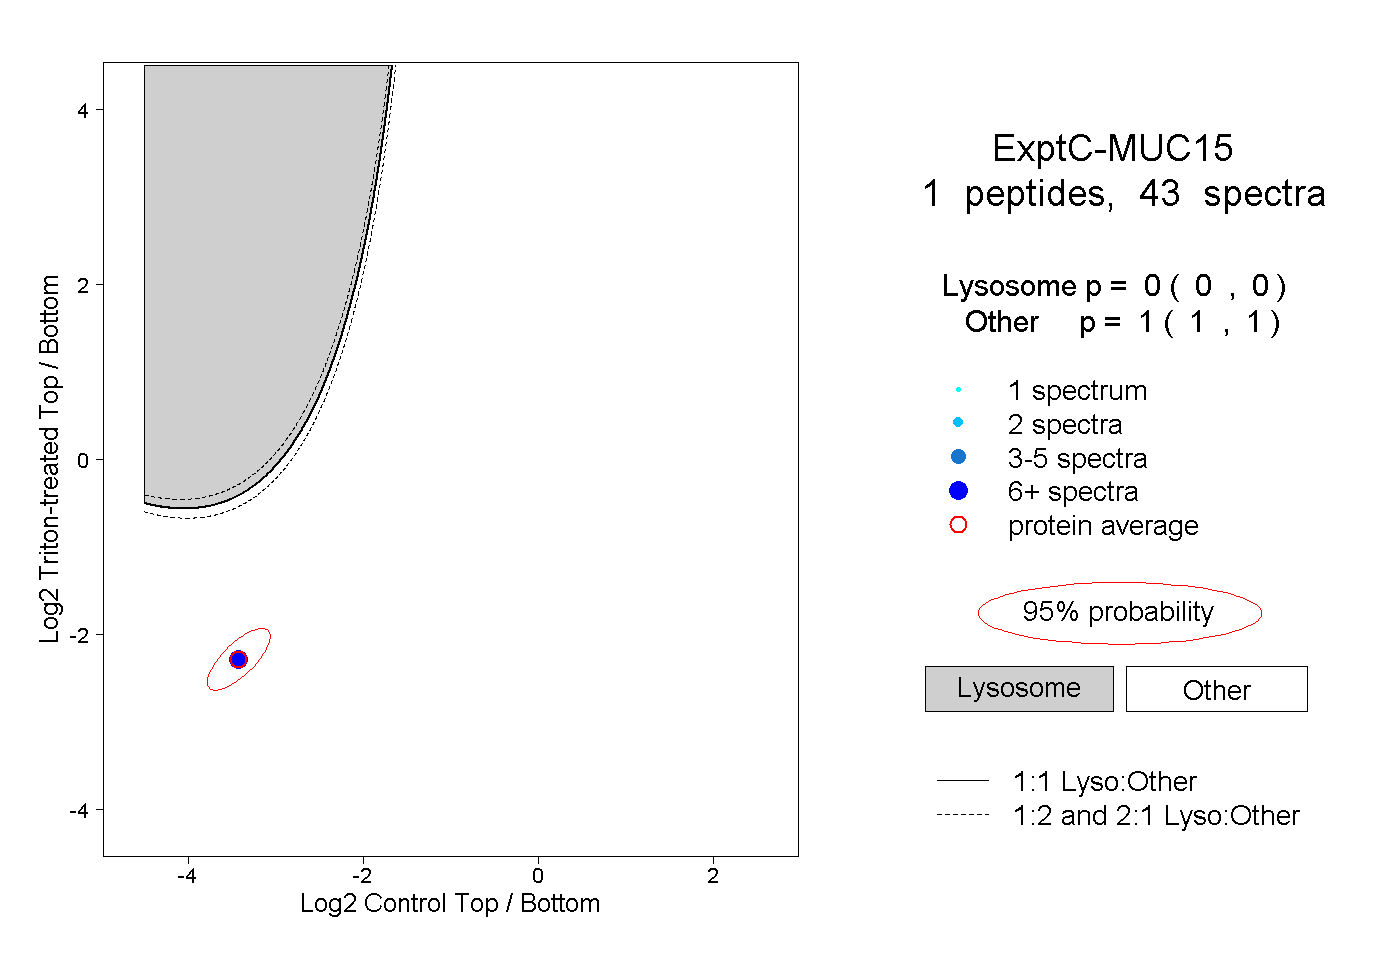 |
0.000 0.000 | 0.000 |
1.000 1.000 | 1.000 |