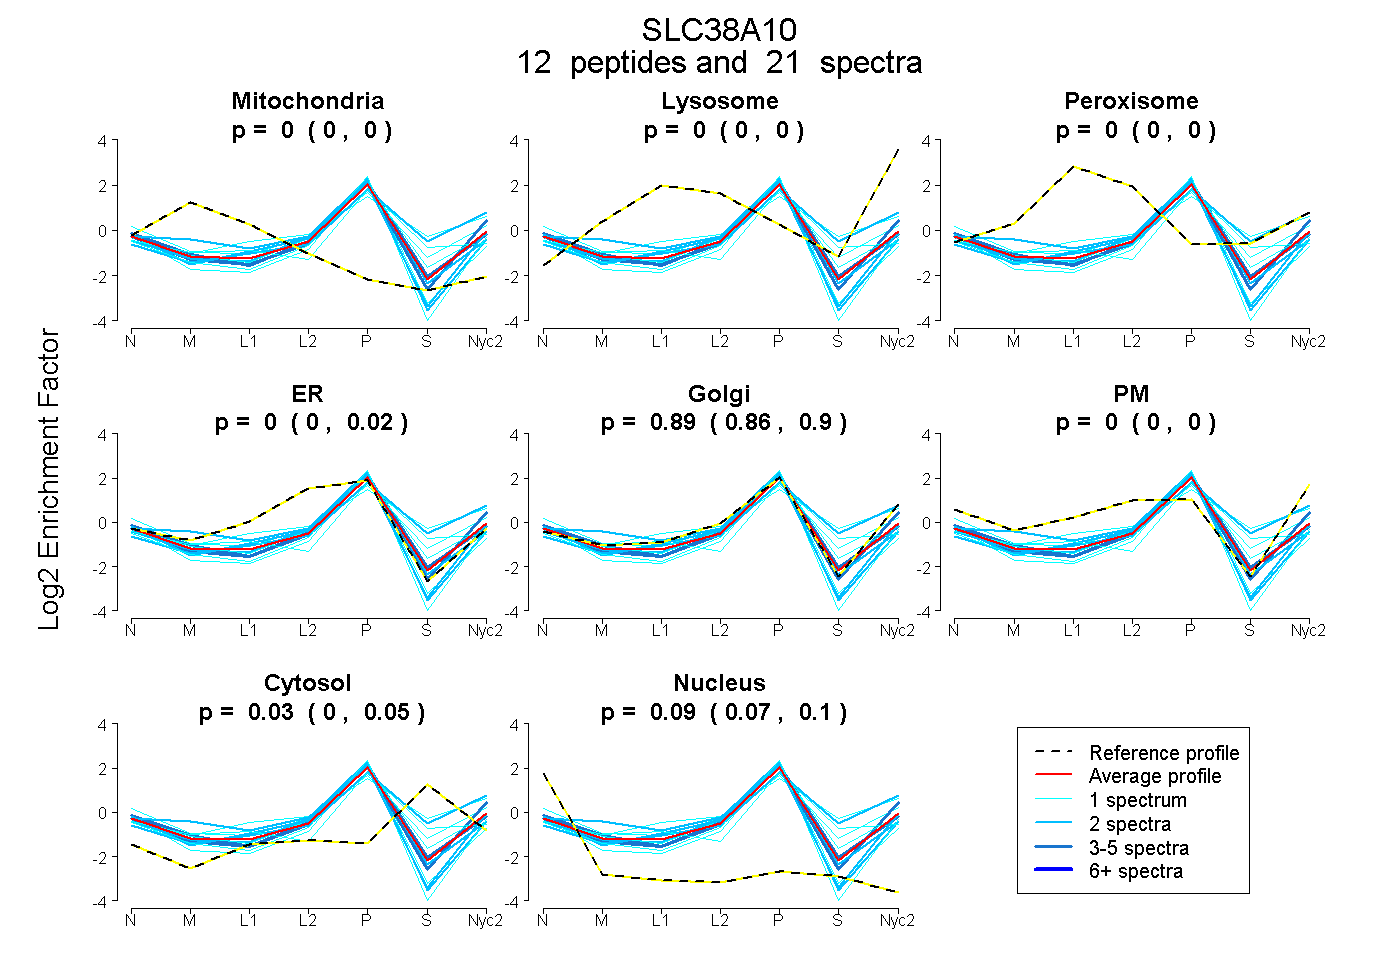
 12
12peptides
spectra
0.000 | 0.000
0.000 | 0.000
0.000 | 0.000
0.000 | 0.017
0.862 | 0.898
0.000 | 0.000
0.000 | 0.049
0.074 | 0.098
| Plot | Mito | Lyso | Perox | ER | Golgi | PM | Cytosol | Nucleus | |||||
| Expt A |
12 peptides |
21 spectra |
|
0.000 0.000 | 0.000 |
0.000 0.000 | 0.000 |
0.000 0.000 | 0.000 |
0.000 0.000 | 0.017 |
0.887 0.862 | 0.898 |
0.000 0.000 | 0.000 |
0.026 0.000 | 0.049 |
0.087 0.074 | 0.098 |
| 1 spectrum, LLDQQEK | 0.000 | 0.000 | 0.000 | 0.031 | 0.802 | 0.000 | 0.114 | 0.053 | ||
| 2 spectra, HEPPIPHDK | 0.000 | 0.000 | 0.000 | 0.172 | 0.719 | 0.000 | 0.000 | 0.109 | ||
| 2 spectra, WEGVFR | 0.100 | 0.000 | 0.000 | 0.147 | 0.733 | 0.000 | 0.000 | 0.019 | ||
| 2 spectra, QRPDPNSGPK | 0.000 | 0.000 | 0.000 | 0.171 | 0.713 | 0.000 | 0.000 | 0.117 | ||
| 2 spectra, LPDEGDPAGR | 0.000 | 0.026 | 0.000 | 0.000 | 0.689 | 0.000 | 0.285 | 0.000 | ||
| 1 spectrum, DAVAPGADTQK | 0.000 | 0.048 | 0.100 | 0.000 | 0.587 | 0.000 | 0.265 | 0.000 | ||
| 4 spectra, AGLAVQRPEAAEQR | 0.000 | 0.000 | 0.000 | 0.000 | 0.860 | 0.000 | 0.040 | 0.100 | ||
| 1 spectrum, GHPAPSQDK | 0.000 | 0.000 | 0.000 | 0.032 | 0.684 | 0.080 | 0.184 | 0.021 | ||
| 1 spectrum, EAAQPLVGAEAEDSHSK | 0.000 | 0.000 | 0.000 | 0.000 | 0.807 | 0.000 | 0.000 | 0.193 | ||
| 1 spectrum, VSVELNDLVAGEGK | 0.019 | 0.000 | 0.000 | 0.000 | 0.663 | 0.000 | 0.294 | 0.023 | ||
| 3 spectra, LLAVIEEQHK | 0.000 | 0.000 | 0.000 | 0.000 | 0.923 | 0.000 | 0.000 | 0.077 | ||
| 1 spectrum, VAEAVR | 0.000 | 0.000 | 0.000 | 0.000 | 0.868 | 0.000 | 0.000 | 0.132 |
| Plot | Mito | Lyso or Perox | ER | Golgi | PM | Cytosol | Nucleus | ||||||
| Expt B |
1 peptide |
1 spectrum |
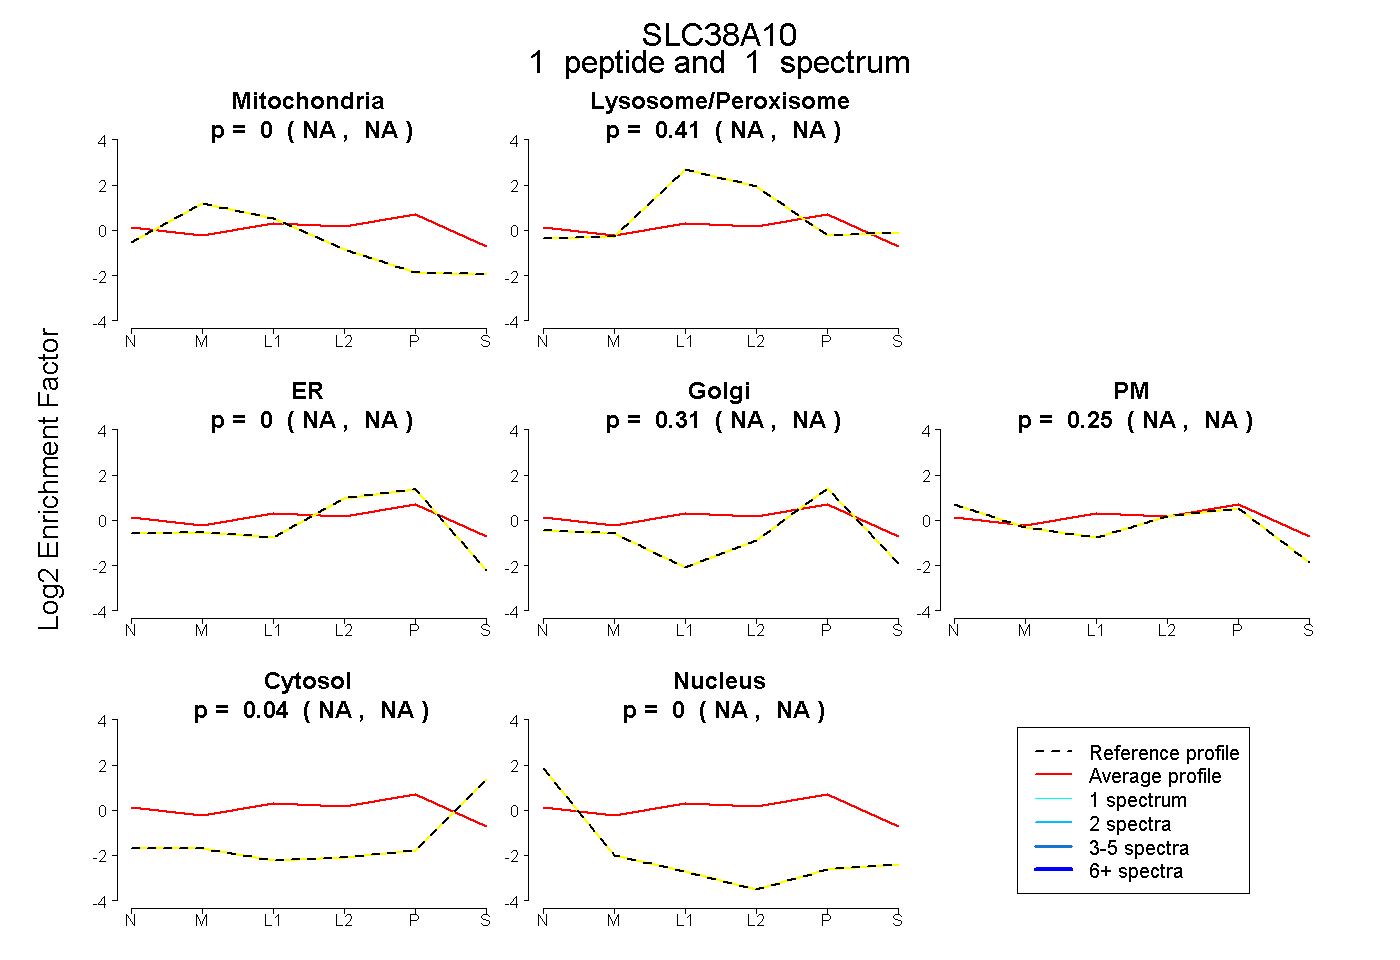 |
0.000 NA | NA |
0.406 NA | NA |
0.000 NA | NA |
0.309 NA | NA |
0.249 NA | NA |
0.036 NA | NA |
0.000 NA | NA |
|||
| Plot | Lyso | Other | |||||||||||
| Expt C |
6 peptides |
11 spectra |
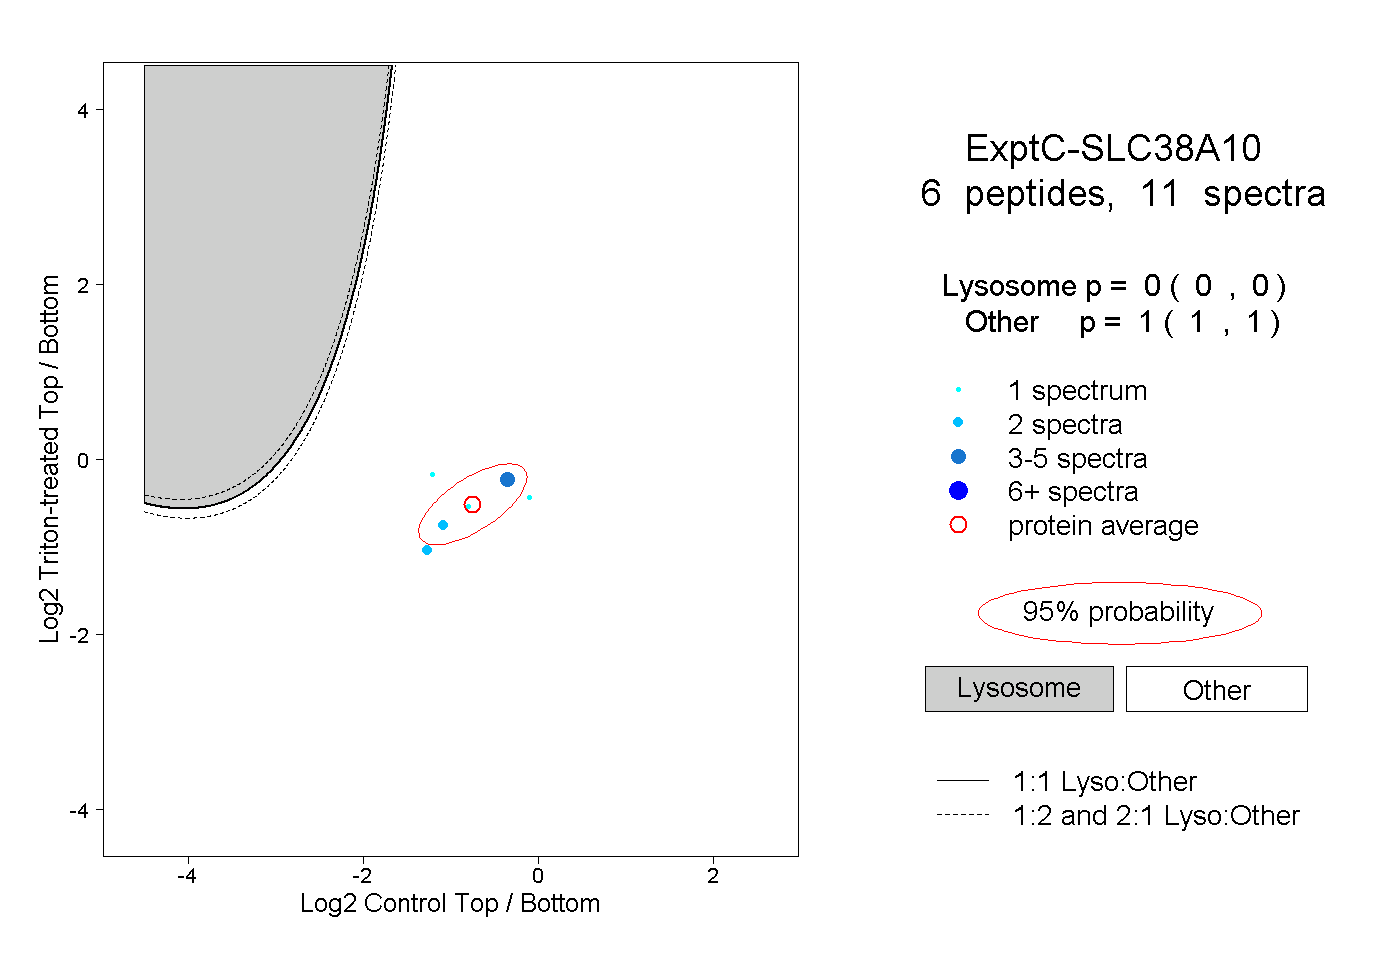 |
0.000 0.000 | 0.000 |
1.000 1.000 | 1.000 |