 15
15peptides
spectra

0.450 | 0.468
0.000 | 0.006
0.239 | 0.267
0.276 | 0.294
0.000 | 0.000
0.000 | 0.000
0.000 | 0.000
0.000 | 0.000
7peptides
spectra
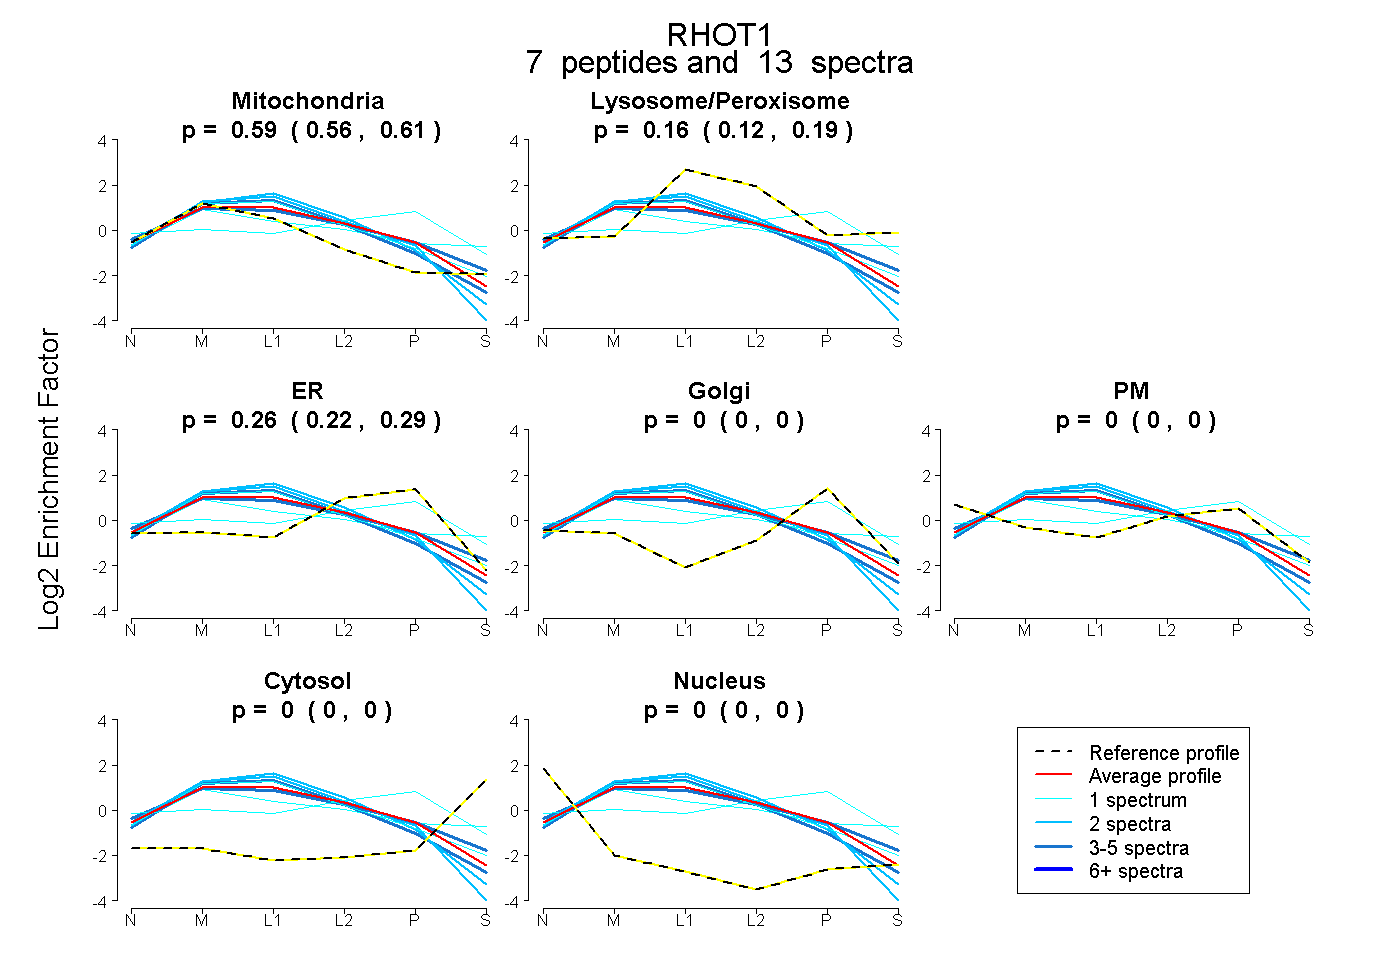
0.559 | 0.607
0.120 | 0.189
0.221 | 0.288
0.000 | 0.000
0.000 | 0.000
0.000 | 0.000
0.000 | 0.000
19peptides
spectra

0.000 | 0.000
1.000 | 1.000
4peptides
spectra

0.000 | 0.011
0.989 | 1.000