14
14peptides
spectra
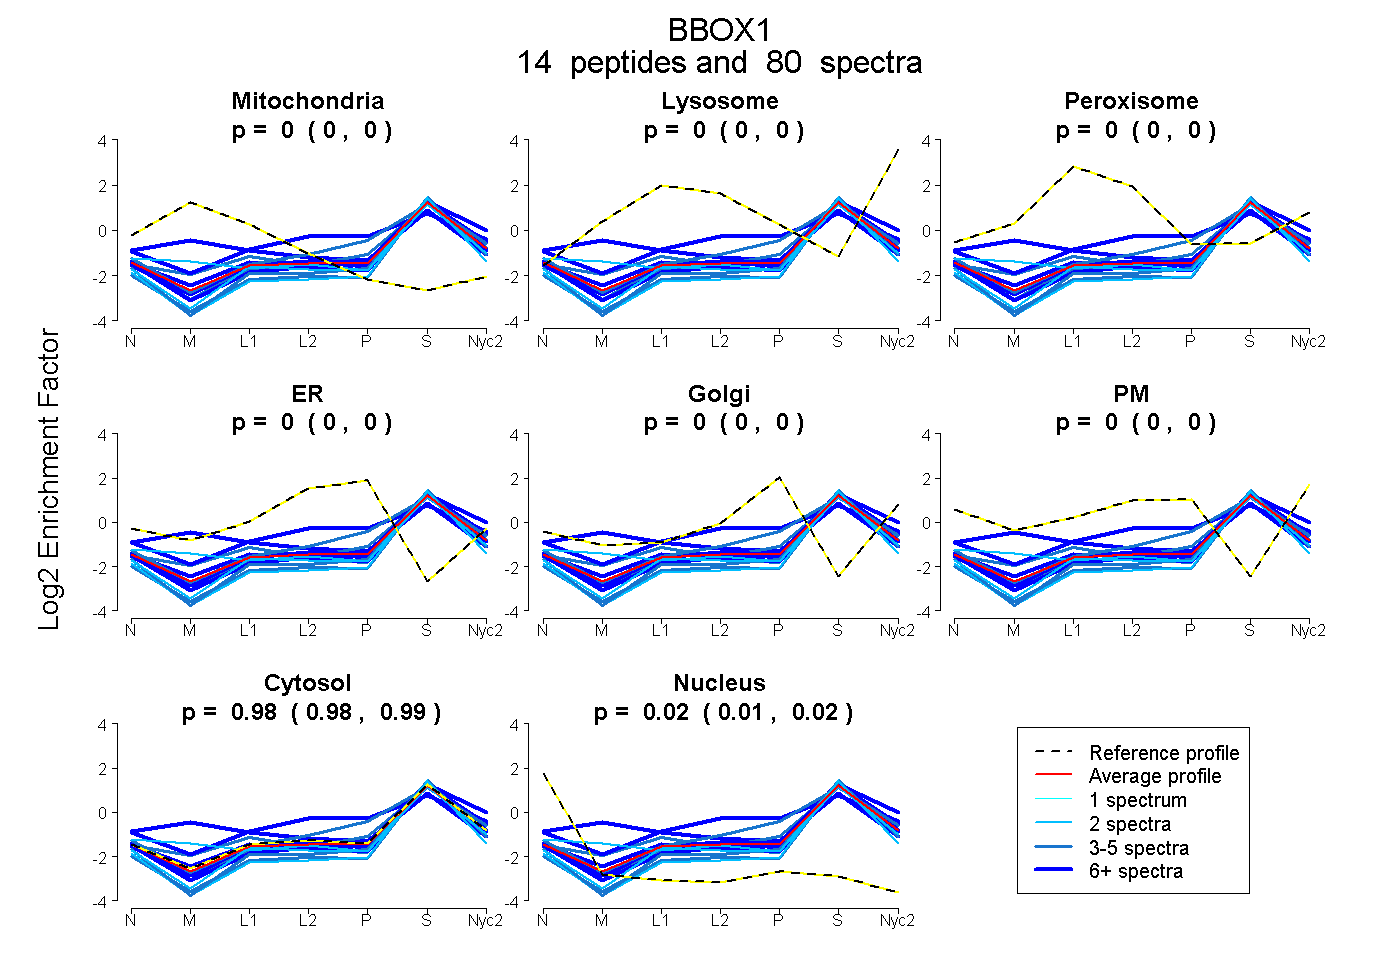
0.000 | 0.000
0.000 | 0.000
0.000 | 0.000
0.000 | 0.000
0.000 | 0.000
0.000 | 0.000
0.981 | 0.987
0.013 | 0.018
9peptides
spectra
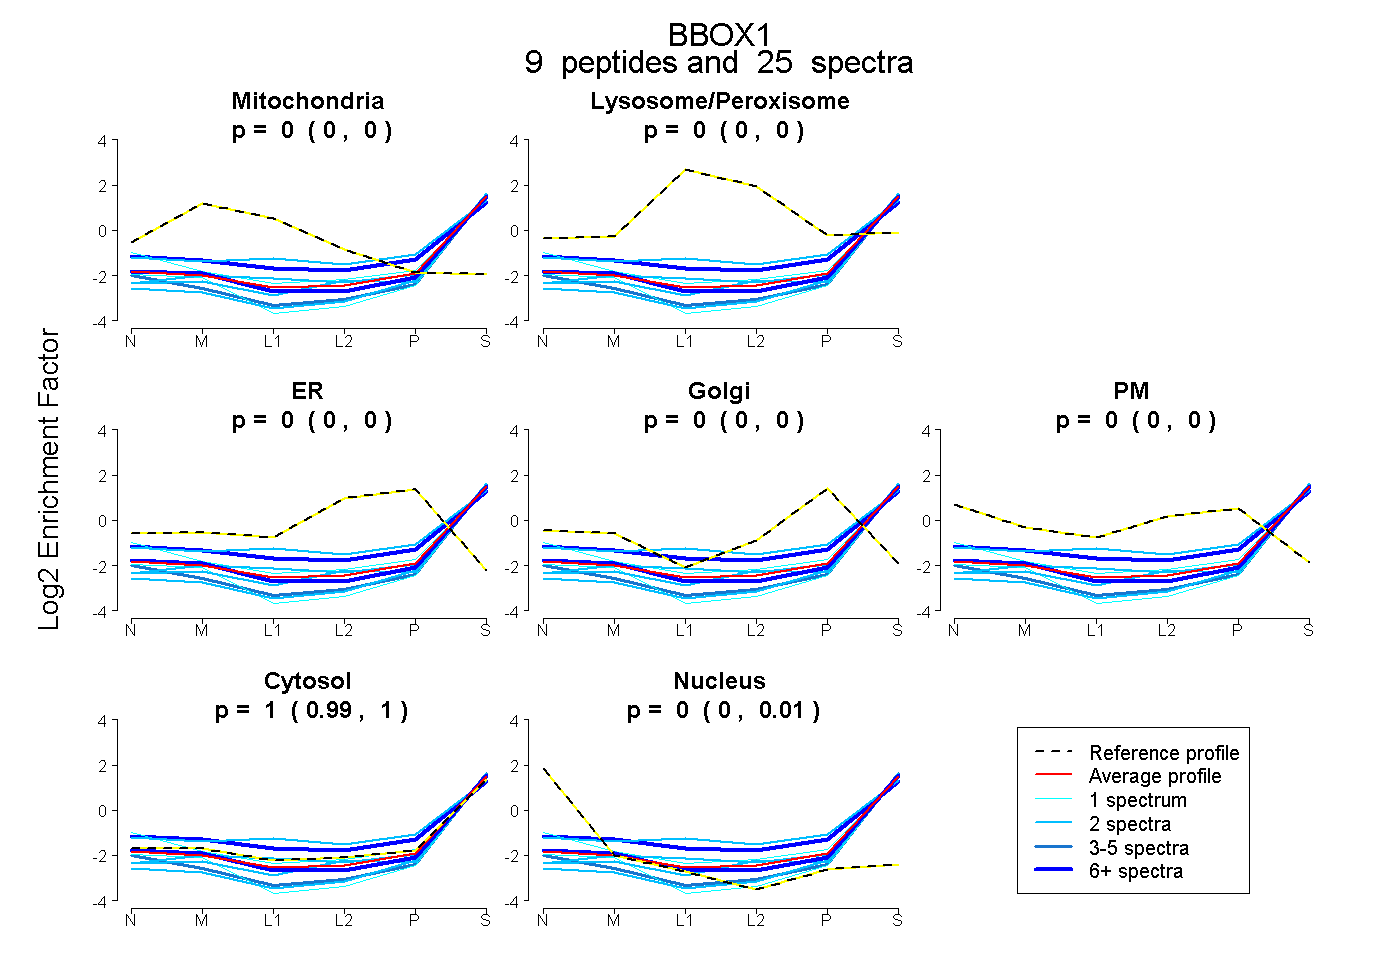
0.000 | 0.000
0.000 | 0.000
0.000 | 0.000
0.000 | 0.000
0.000 | 0.000
0.988 | 1.000
0.000 | 0.010
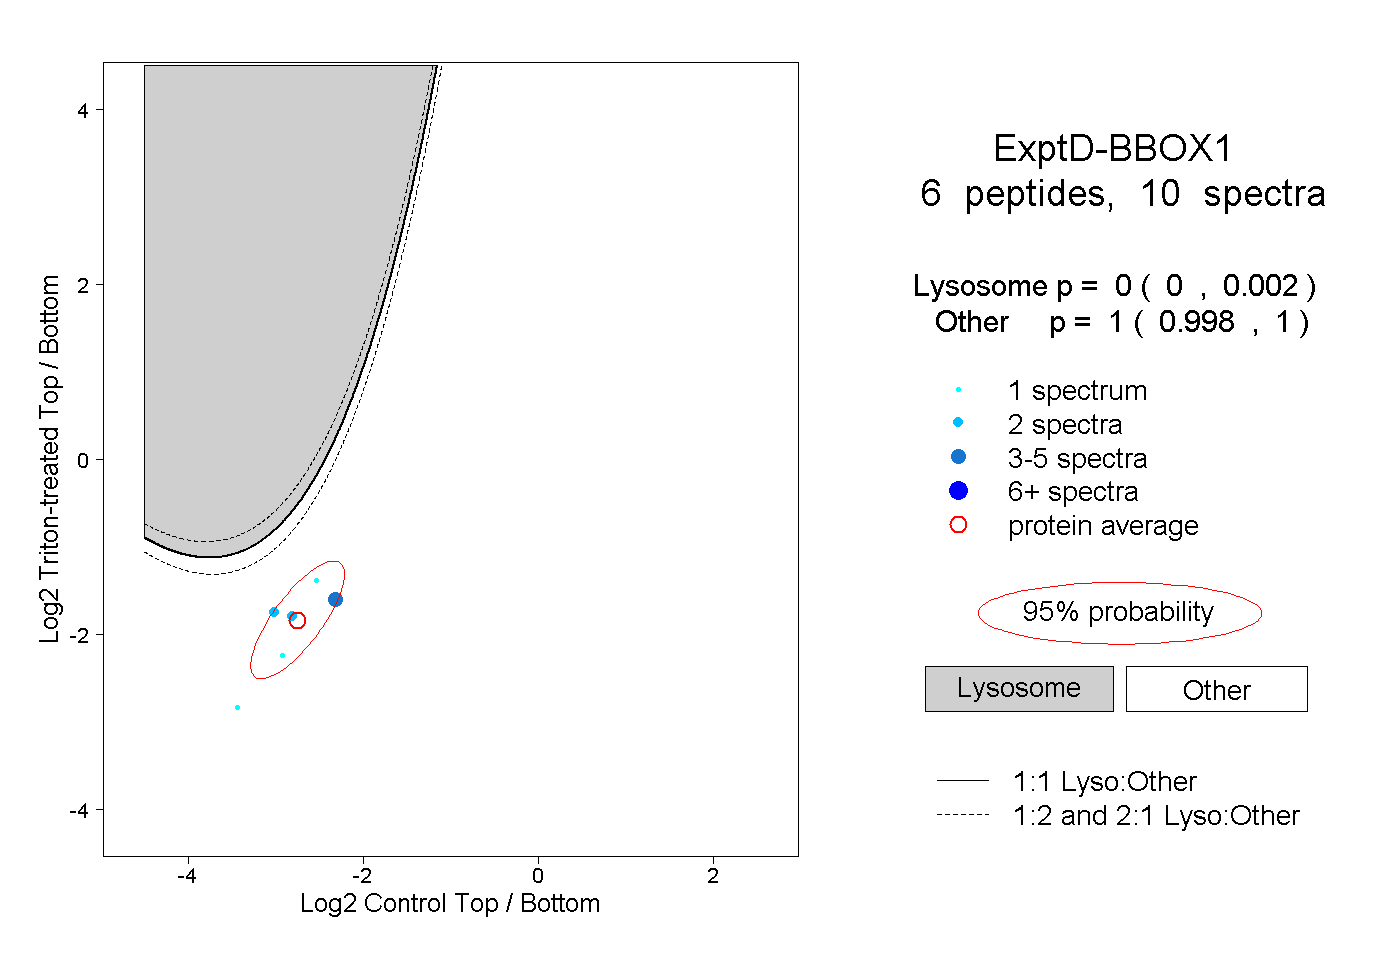
16peptides
spectra
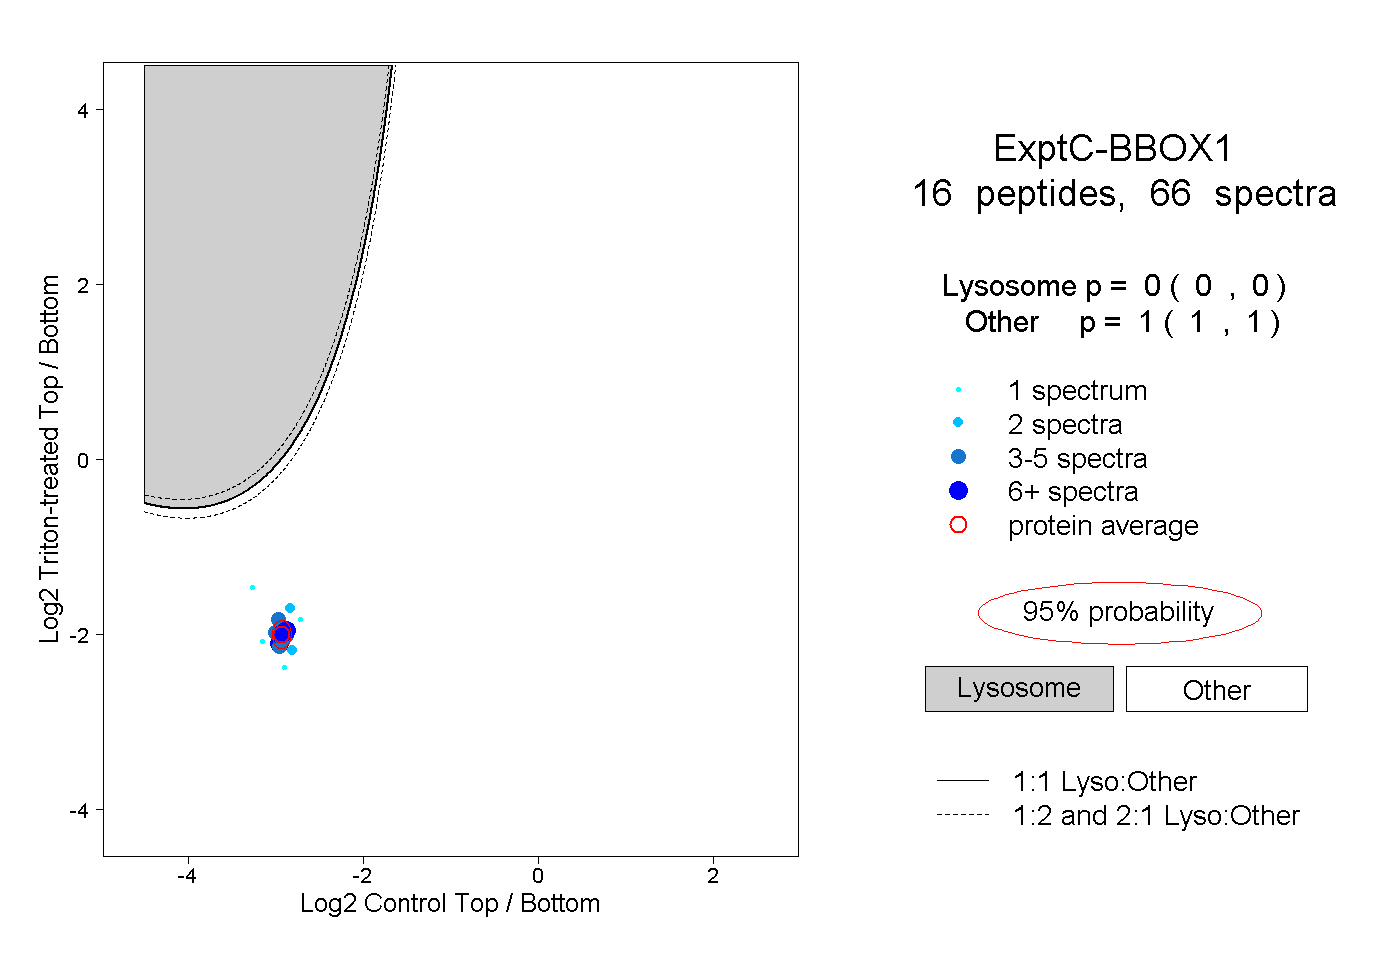
0.000 | 0.000
1.000 | 1.000