 4
4peptides
spectra
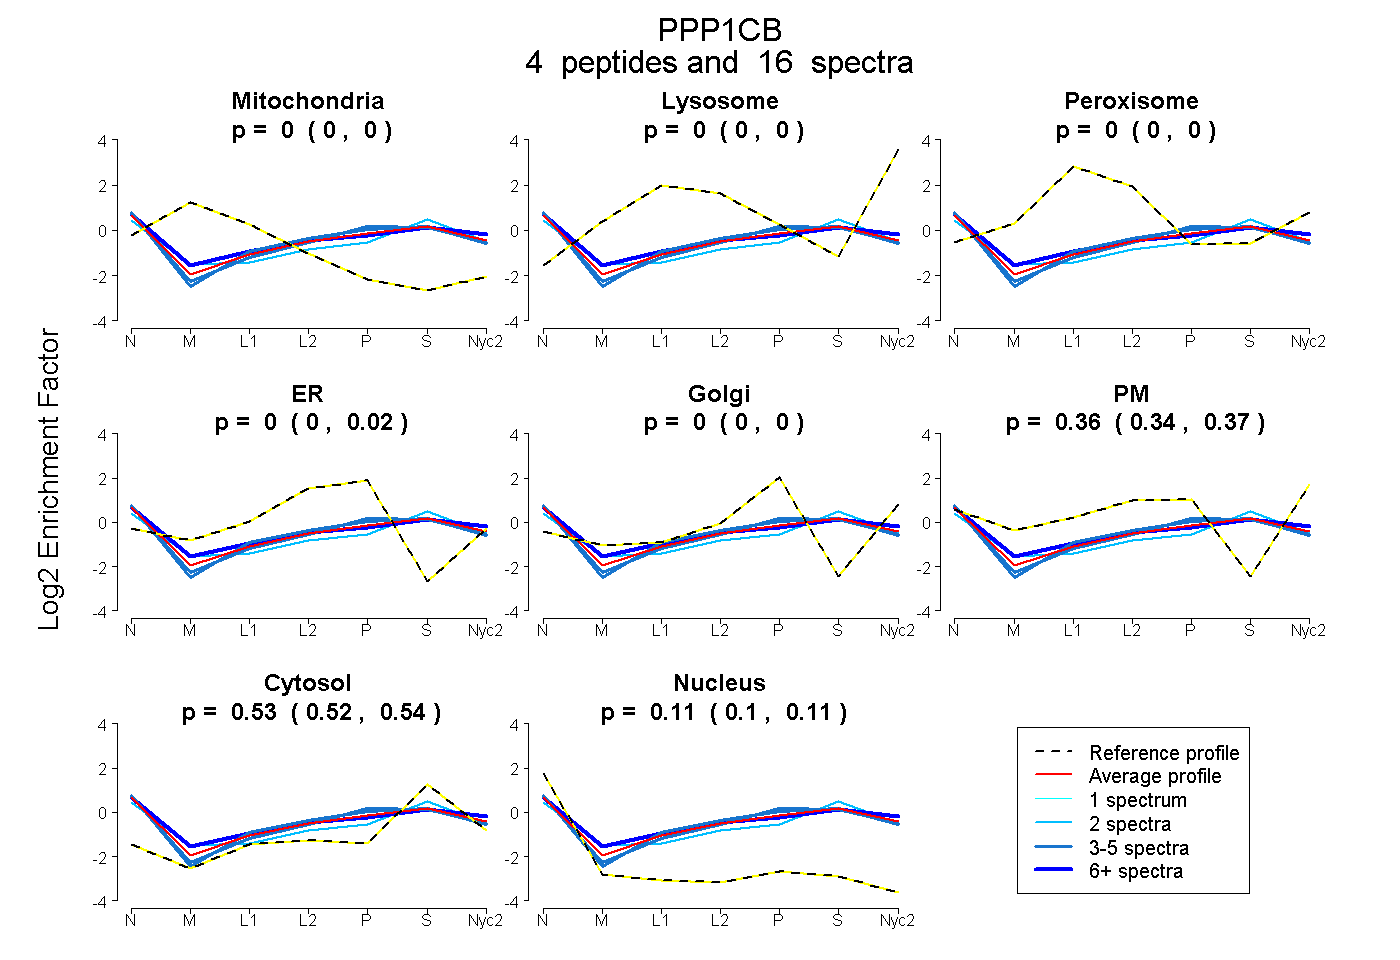
0.000 | 0.000
0.000 | 0.000
0.000 | 0.000
0.000 | 0.018
0.000 | 0.000
0.339 | 0.368
0.522 | 0.537
0.101 | 0.113
2peptides
spectra
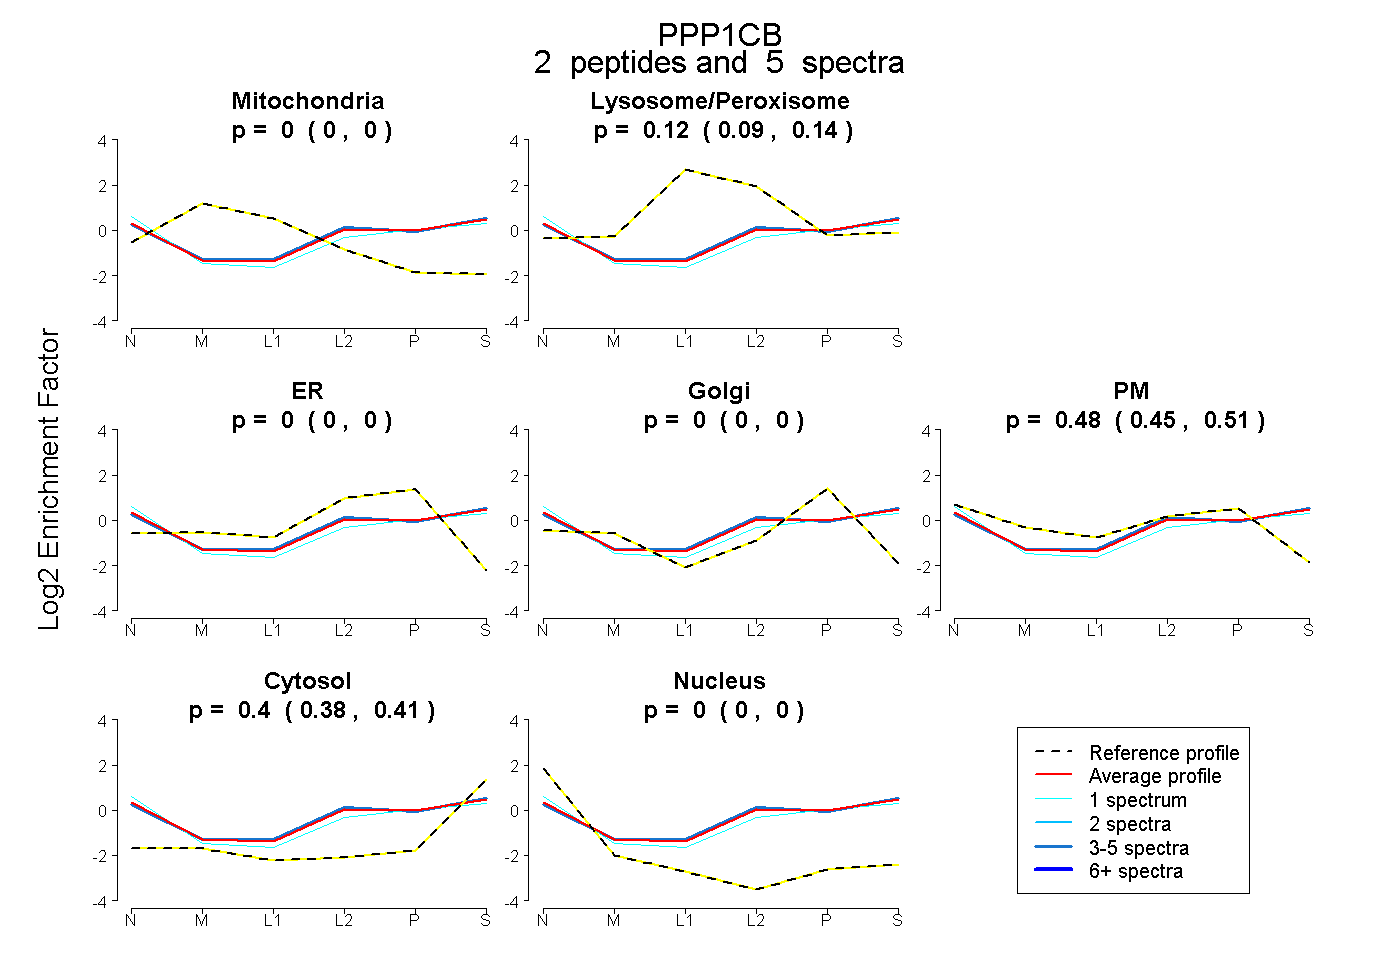
0.000 | 0.000
0.088 | 0.140
0.000 | 0.000
0.000 | 0.000
0.454 | 0.507
0.384 | 0.414
0.000 | 0.000
8peptides
spectra

0.000 | 0.000
1.000 | 1.000
1peptide
spectrum
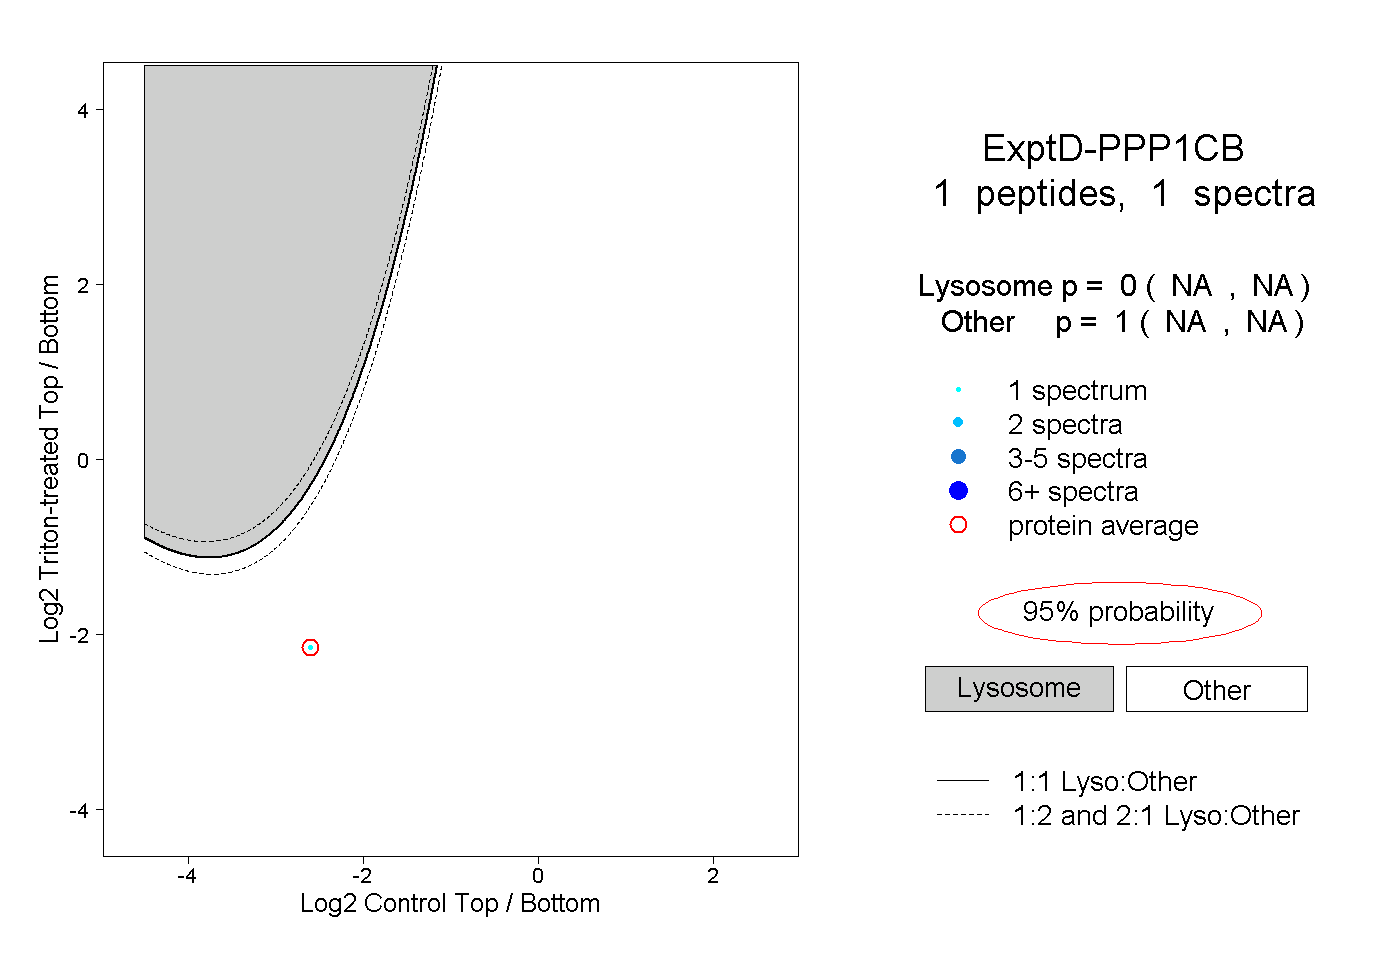
NA | NA
NA | NA