 3
3peptides
spectra
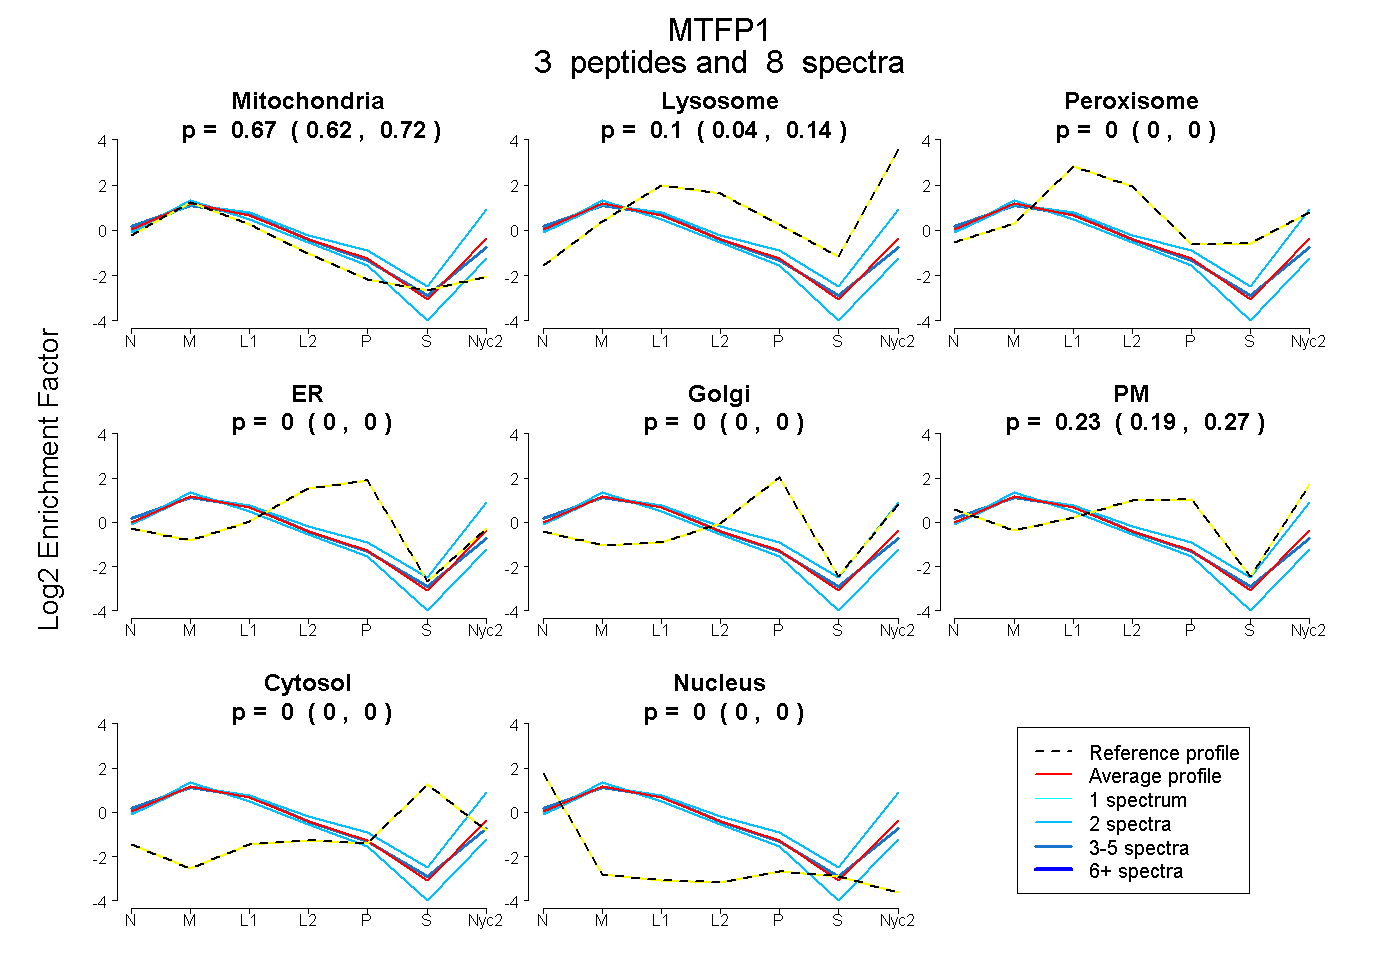
0.621 | 0.715
0.036 | 0.141
0.000 | 0.000
0.000 | 0.000
0.000 | 0.000
0.194 | 0.266
0.000 | 0.000
0.000 | 0.000
3peptides
spectra
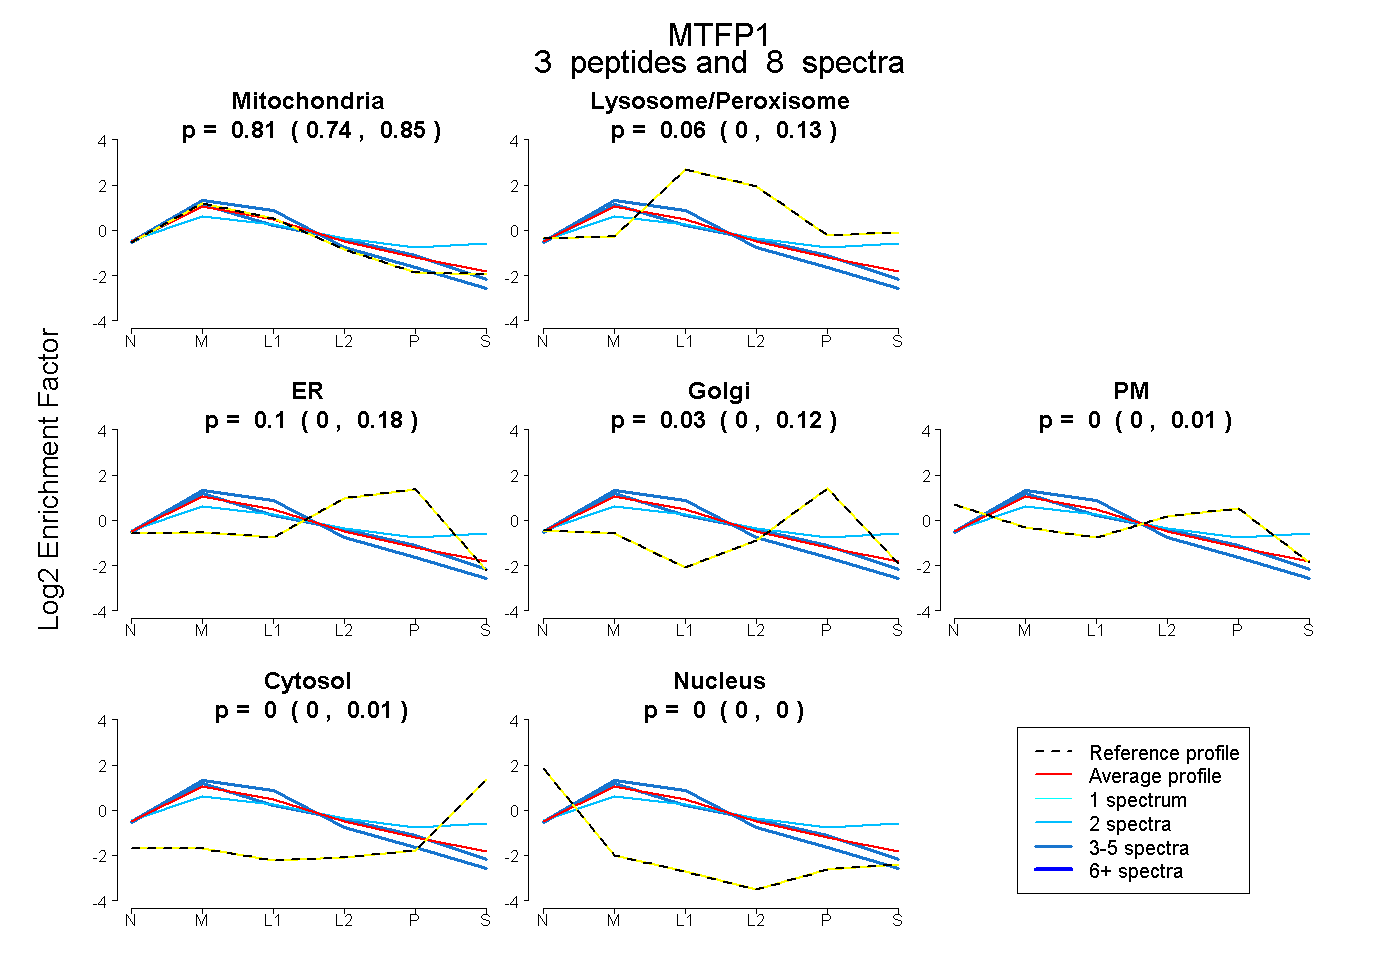
0.739 | 0.852
0.000 | 0.129
0.000 | 0.177
0.000 | 0.121
0.000 | 0.015
0.000 | 0.010
0.000 | 0.000
6peptides
spectra
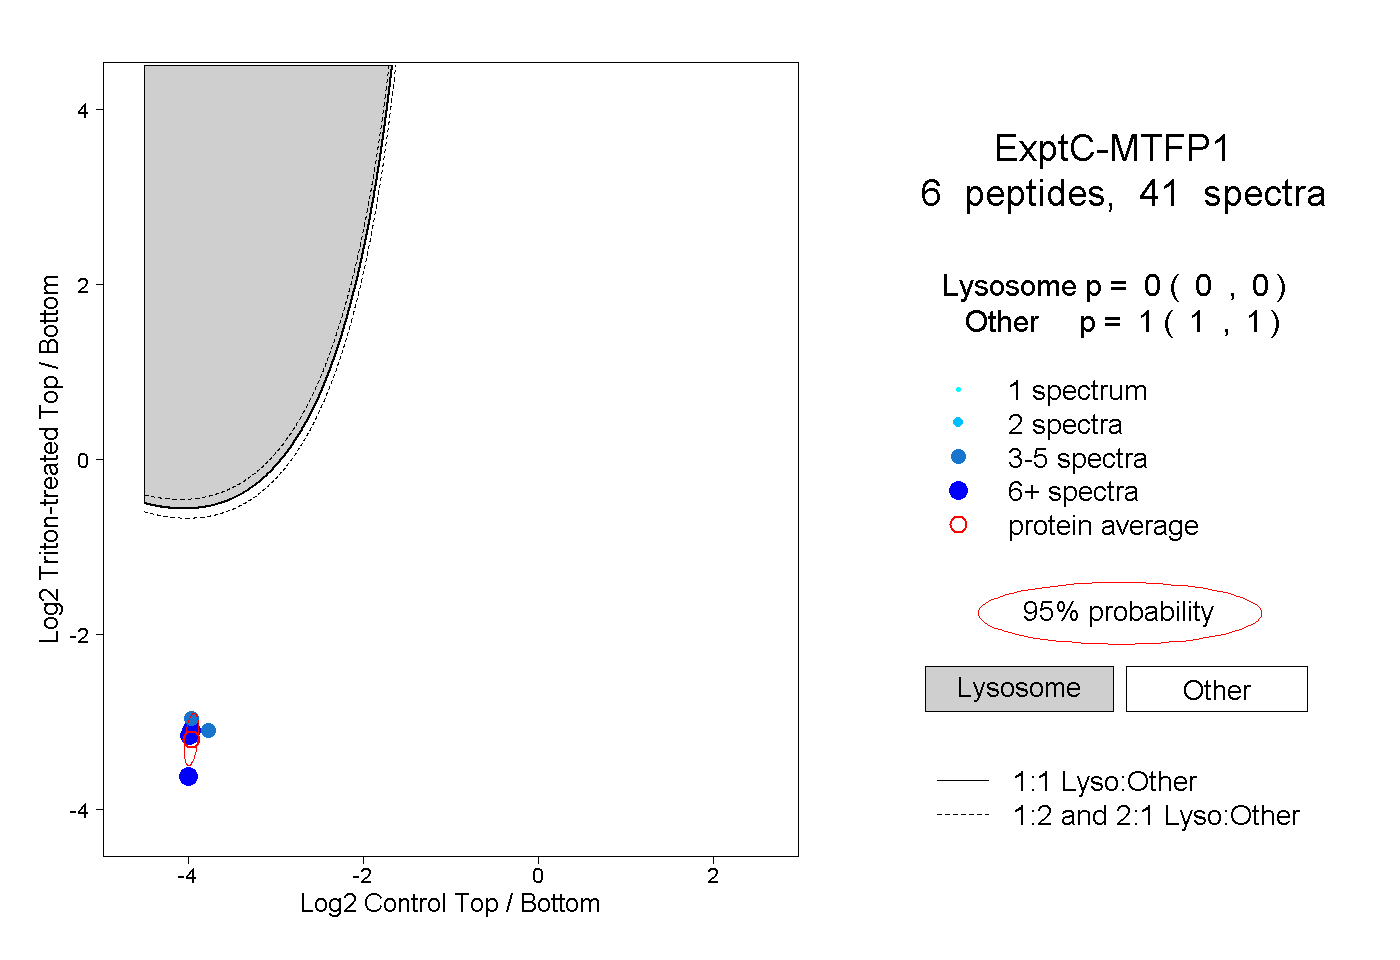
0.000 | 0.000
1.000 | 1.000
2peptides
spectra

0.000 | 0.006
0.994 | 1.000