 27
27peptides
spectra
0.078 | 0.084
0.000 | 0.000
0.000 | 0.000
0.093 | 0.105
0.123 | 0.134
0.663 | 0.672
0.000 | 0.000
0.019 | 0.023
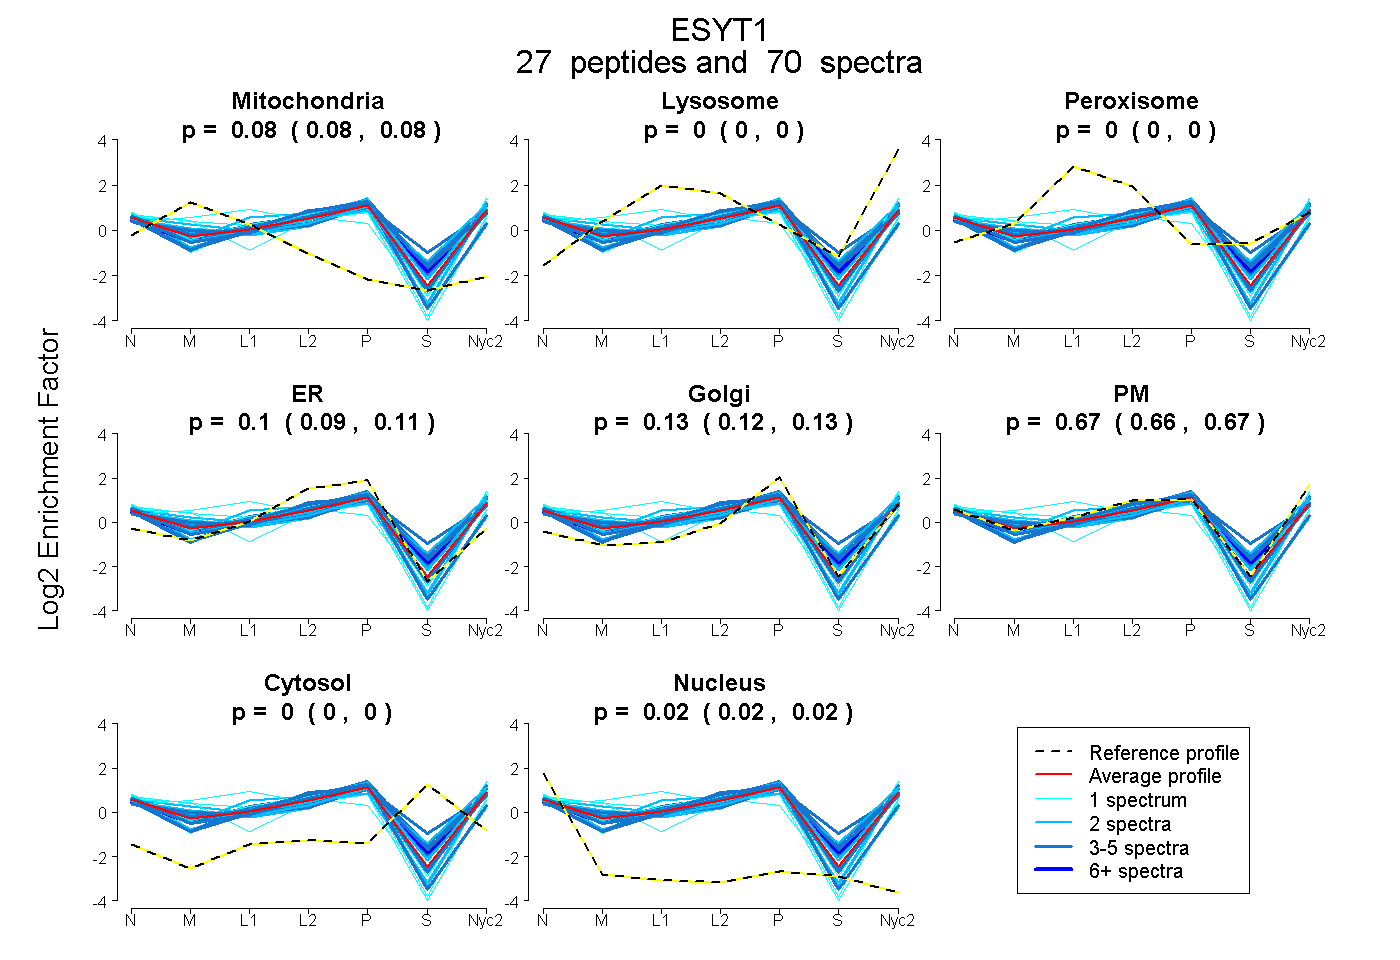
| Plot | Mito | Lyso | Perox | ER | Golgi | PM | Cytosol | Nucleus | |||||
| Expt A |
27 peptides |
70 spectra |
|
0.082 0.078 | 0.084 |
0.000 0.000 | 0.000 |
0.000 0.000 | 0.000 |
0.100 0.093 | 0.105 |
0.129 0.123 | 0.134 |
0.668 0.663 | 0.672 |
0.000 0.000 | 0.000 |
0.021 0.019 | 0.023 |
| 2 spectra, SEDLPLR | 0.000 | 0.000 | 0.053 | 0.014 | 0.253 | 0.630 | 0.000 | 0.049 | ||
| 3 spectra, ITAETLYMSHR | 0.000 | 0.000 | 0.054 | 0.223 | 0.110 | 0.504 | 0.109 | 0.000 | ||
| 2 spectra, VIDEELNPR | 0.144 | 0.000 | 0.000 | 0.000 | 0.244 | 0.612 | 0.000 | 0.000 | ||
| 4 spectra, VGTQTFCSR | 0.085 | 0.000 | 0.000 | 0.415 | 0.000 | 0.469 | 0.000 | 0.031 | ||
| 2 spectra, LISIIHSCR | 0.085 | 0.000 | 0.000 | 0.455 | 0.000 | 0.436 | 0.000 | 0.024 | ||
| 2 spectra, GITSRPEPPSAAILVVYLDR | 0.022 | 0.000 | 0.000 | 0.124 | 0.078 | 0.739 | 0.000 | 0.038 | ||
| 2 spectra, FEWDLPLDGTLR | 0.000 | 0.000 | 0.000 | 0.118 | 0.169 | 0.630 | 0.000 | 0.083 | ||
| 1 spectrum, LEWLSLLPDAEK | 0.189 | 0.000 | 0.000 | 0.072 | 0.194 | 0.508 | 0.000 | 0.037 | ||
| 7 spectra, GMQLHGVLR | 0.001 | 0.000 | 0.051 | 0.154 | 0.097 | 0.598 | 0.077 | 0.022 | ||
| 2 spectra, AEWLNK | 0.151 | 0.000 | 0.013 | 0.000 | 0.376 | 0.460 | 0.001 | 0.000 | ||
| 1 spectrum, ELPAWVSFPDVEK | 0.020 | 0.000 | 0.000 | 0.096 | 0.000 | 0.845 | 0.000 | 0.039 | ||
| 1 spectrum, SDPYVK | 0.239 | 0.000 | 0.000 | 0.132 | 0.000 | 0.629 | 0.000 | 0.000 | ||
| 2 spectra, QLLDDEER | 0.029 | 0.000 | 0.050 | 0.156 | 0.080 | 0.652 | 0.000 | 0.034 | ||
| 3 spectra, LTVWYHSDEQK | 0.000 | 0.000 | 0.048 | 0.000 | 0.153 | 0.574 | 0.225 | 0.000 | ||
| 1 spectrum, SNSSFMSR | 0.004 | 0.000 | 0.000 | 0.048 | 0.000 | 0.919 | 0.000 | 0.030 | ||
| 5 spectra, LLAETVAPAVR | 0.037 | 0.000 | 0.000 | 0.081 | 0.132 | 0.723 | 0.000 | 0.027 | ||
| 2 spectra, LDQVLQWNR | 0.143 | 0.000 | 0.000 | 0.017 | 0.025 | 0.814 | 0.000 | 0.000 | ||
| 5 spectra, IHLLAAR | 0.036 | 0.000 | 0.000 | 0.107 | 0.015 | 0.819 | 0.000 | 0.023 | ||
| 3 spectra, TLNPEFNER | 0.000 | 0.000 | 0.063 | 0.000 | 0.219 | 0.595 | 0.080 | 0.043 | ||
| 3 spectra, SDPYALVR | 0.099 | 0.000 | 0.000 | 0.078 | 0.187 | 0.619 | 0.000 | 0.016 | ||
| 1 spectrum, ALTLGALTLPLAR | 0.015 | 0.000 | 0.000 | 0.087 | 0.000 | 0.871 | 0.000 | 0.027 | ||
| 1 spectrum, DGGSGVPPAGPGAASEALAVLTSFGR | 0.000 | 0.000 | 0.000 | 0.139 | 0.188 | 0.617 | 0.000 | 0.057 | ||
| 4 spectra, WFALSGQGQVLMR | 0.109 | 0.000 | 0.000 | 0.124 | 0.162 | 0.605 | 0.000 | 0.000 | ||
| 1 spectrum, FLGGLVK | 0.191 | 0.000 | 0.000 | 0.000 | 0.000 | 0.809 | 0.000 | 0.000 | ||
| 2 spectra, SQELDVQVK | 0.028 | 0.000 | 0.061 | 0.000 | 0.033 | 0.742 | 0.135 | 0.000 | ||
| 4 spectra, GANPHLQTFTFTR | 0.114 | 0.000 | 0.041 | 0.000 | 0.252 | 0.553 | 0.028 | 0.011 | ||
| 4 spectra, ILYLDSSEMR | 0.000 | 0.000 | 0.164 | 0.000 | 0.284 | 0.469 | 0.077 | 0.005 |
| Plot | Mito | Lyso or Perox | ER | Golgi | PM | Cytosol | Nucleus | ||||||
| Expt B |
10 peptides |
19 spectra |
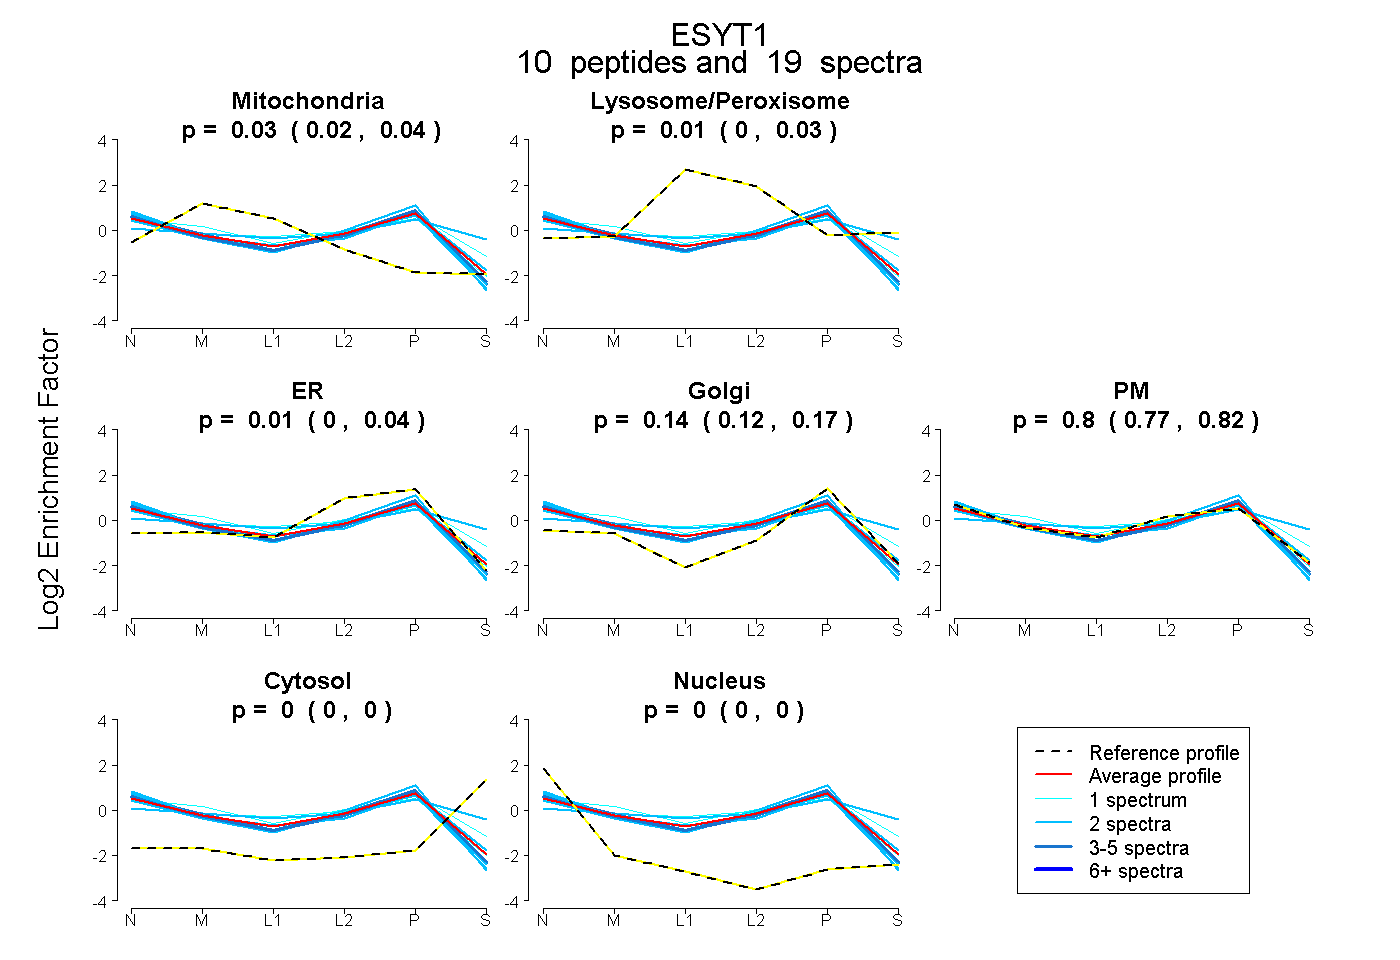 |
0.034 0.024 | 0.043 |
0.008 0.000 | 0.026 |
0.012 0.000 | 0.038 |
0.143 0.122 | 0.167 |
0.802 0.773 | 0.819 |
0.000 0.000 | 0.000 |
0.000 0.000 | 0.000 |
|||
| Plot | Lyso | Other | |||||||||||
| Expt C |
30 peptides |
148 spectra |
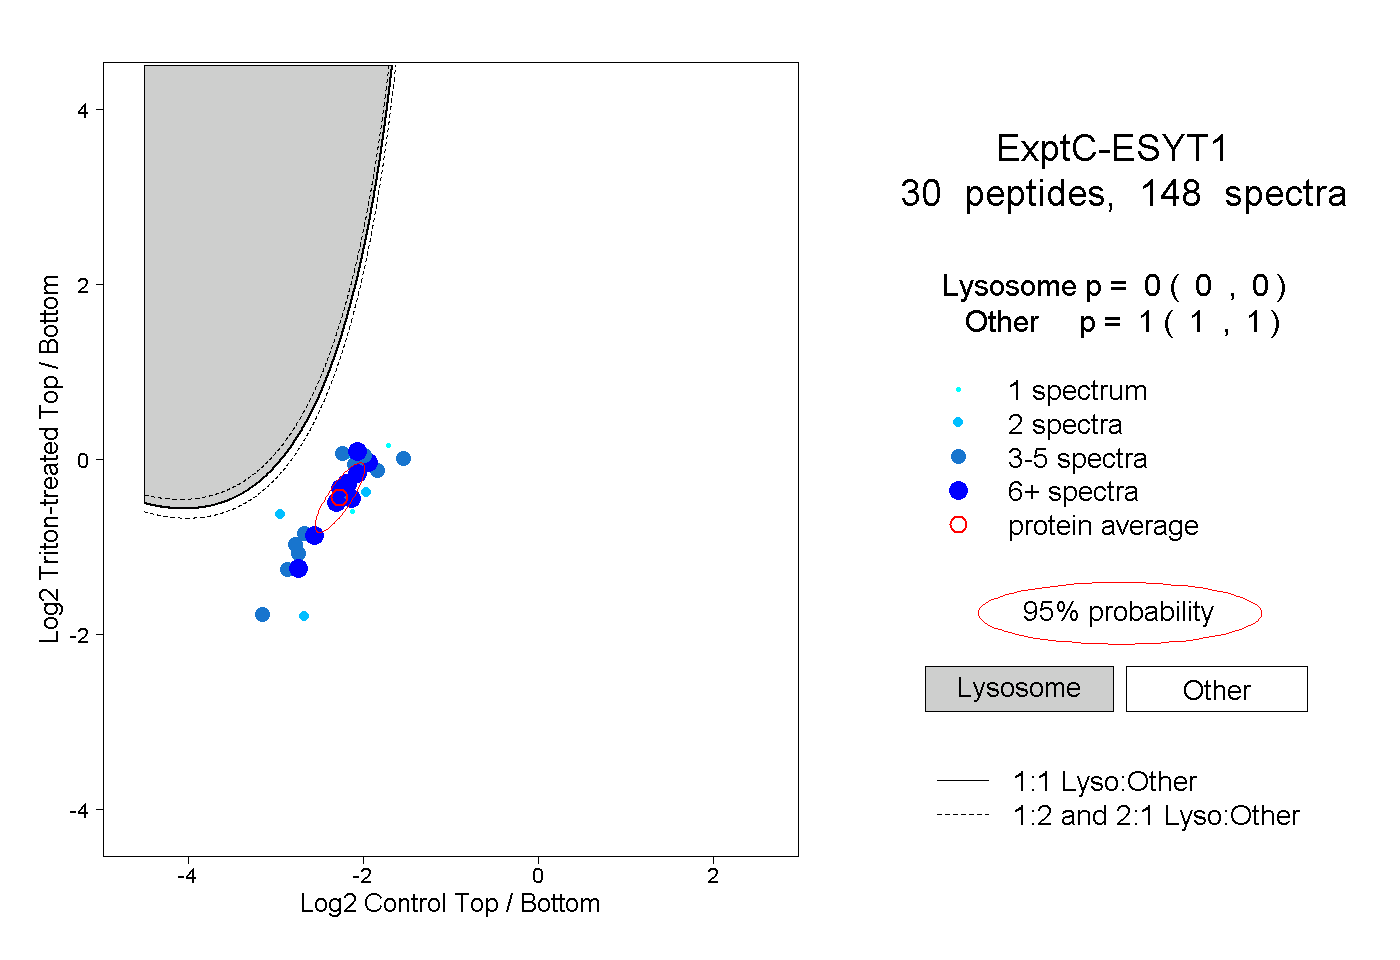 |
0.000 0.000 | 0.000 |
1.000 1.000 | 1.000 |
||||||||
| Plot | Lyso | Other | |||||||||||
| Expt D |
7 peptides |
9 spectra |
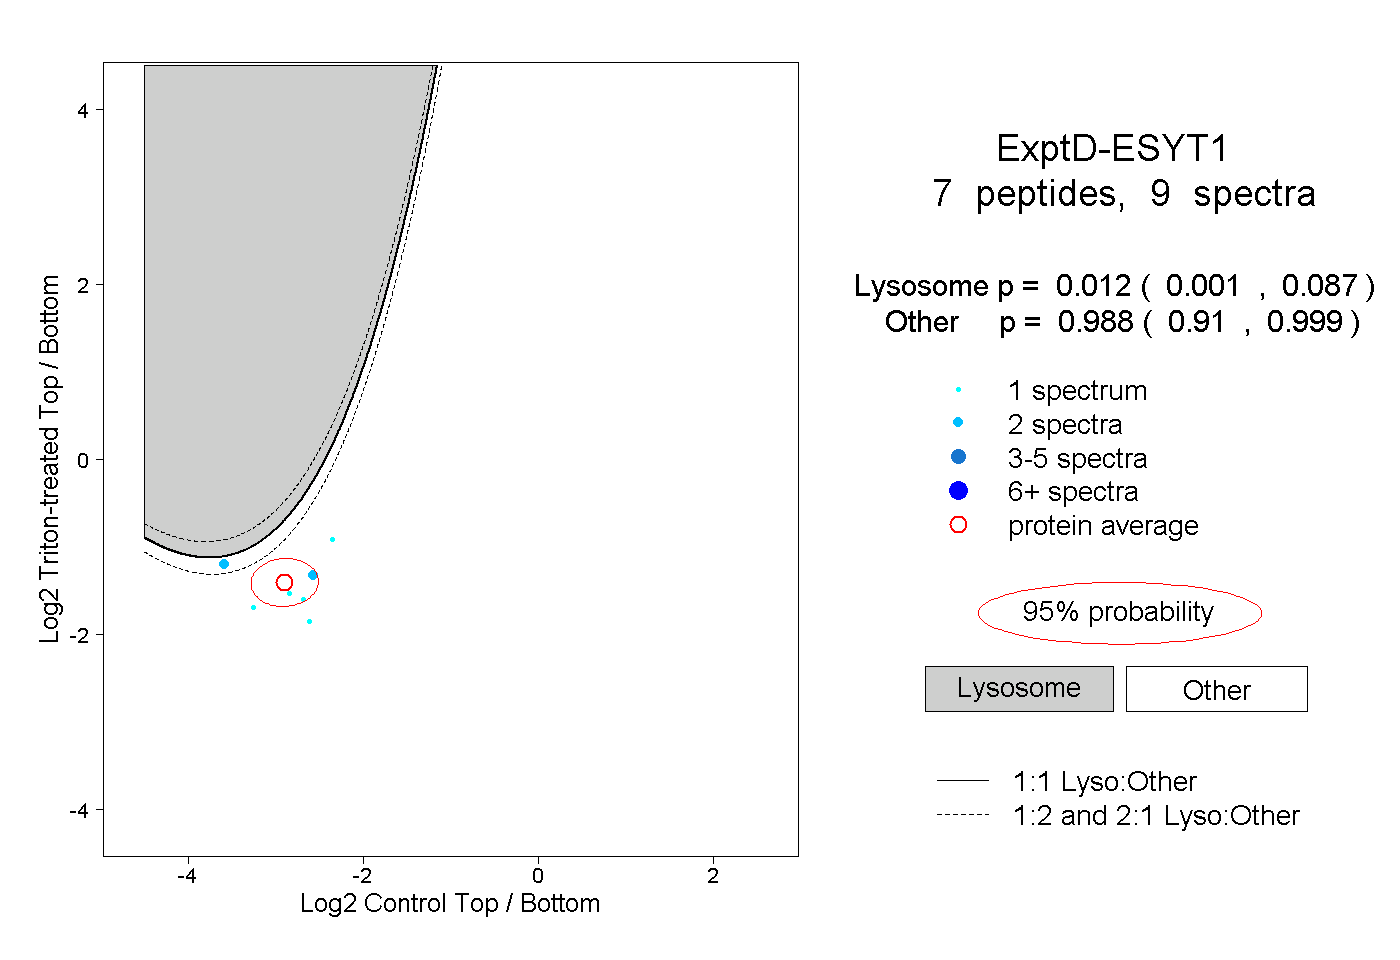 |
0.012 0.001 | 0.087 |
0.988 0.910 | 0.999 |