27
27peptides
spectra
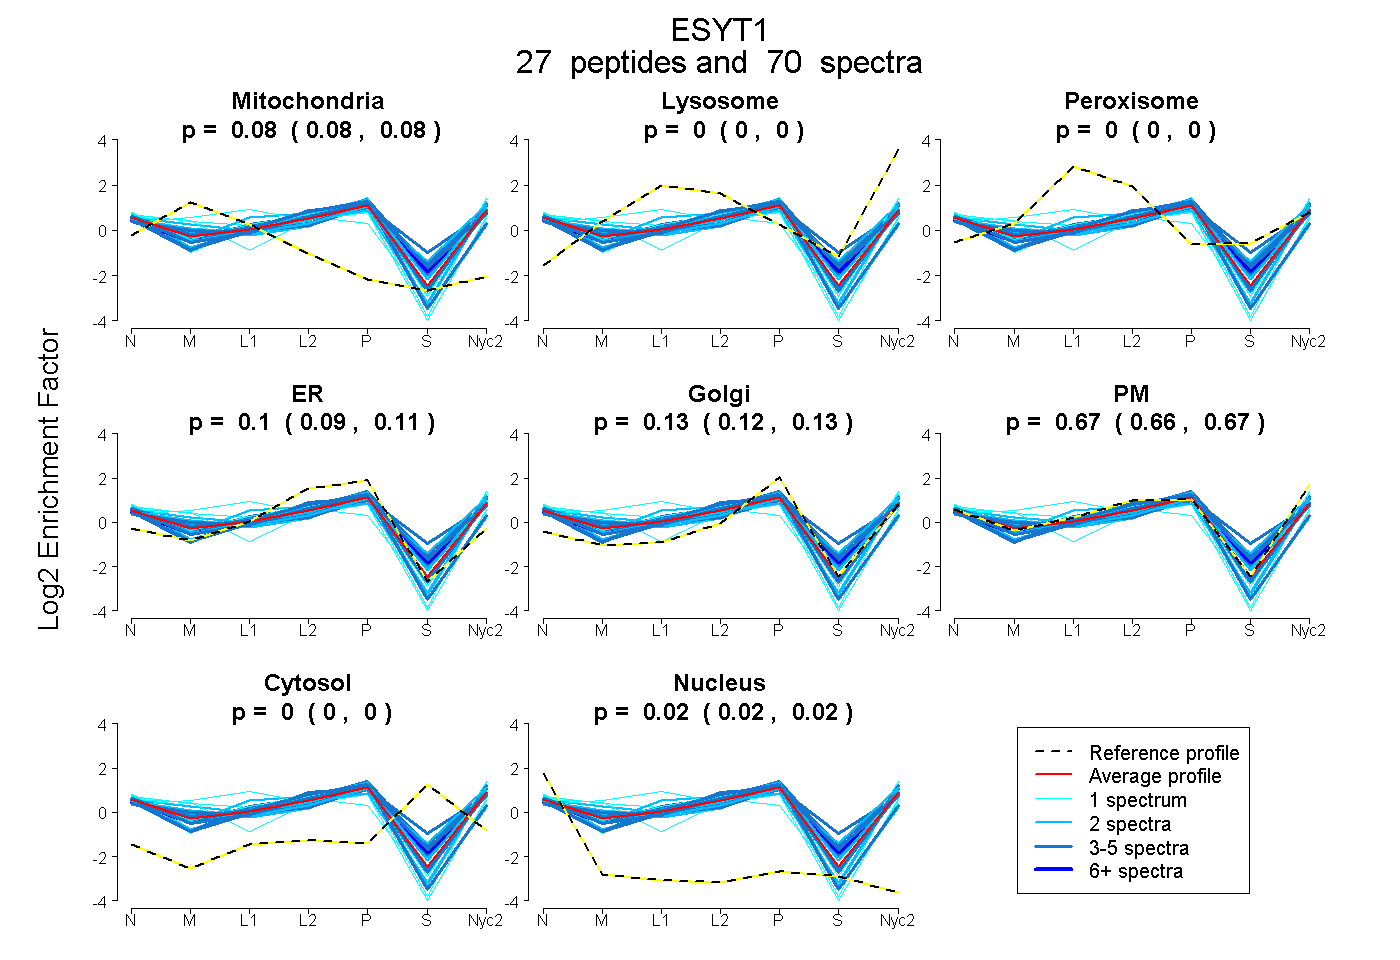
0.078 | 0.084
0.000 | 0.000
0.000 | 0.000
0.093 | 0.105
0.123 | 0.134
0.663 | 0.672
0.000 | 0.000
0.019 | 0.023
10peptides
spectra
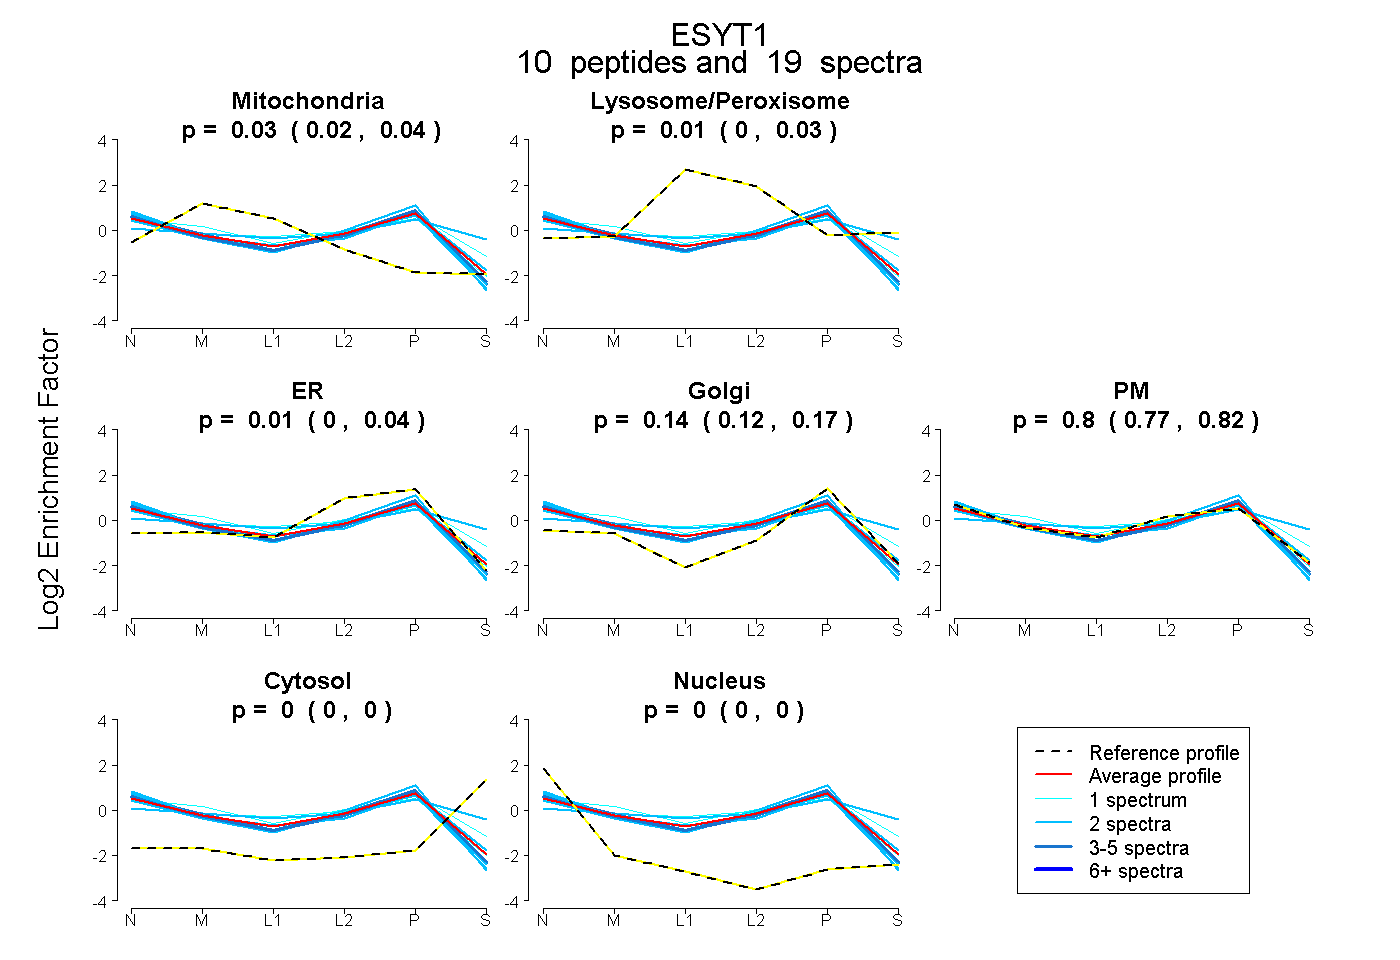
0.024 | 0.043
0.000 | 0.026
0.000 | 0.038
0.122 | 0.167
0.773 | 0.819
0.000 | 0.000
0.000 | 0.000