 3
3peptides
spectra
0.000 | 0.000
0.000 | 0.219
0.000 | 0.192
0.000 | 0.000
0.000 | 0.000
0.247 | 0.389
0.422 | 0.536
0.000 | 0.000
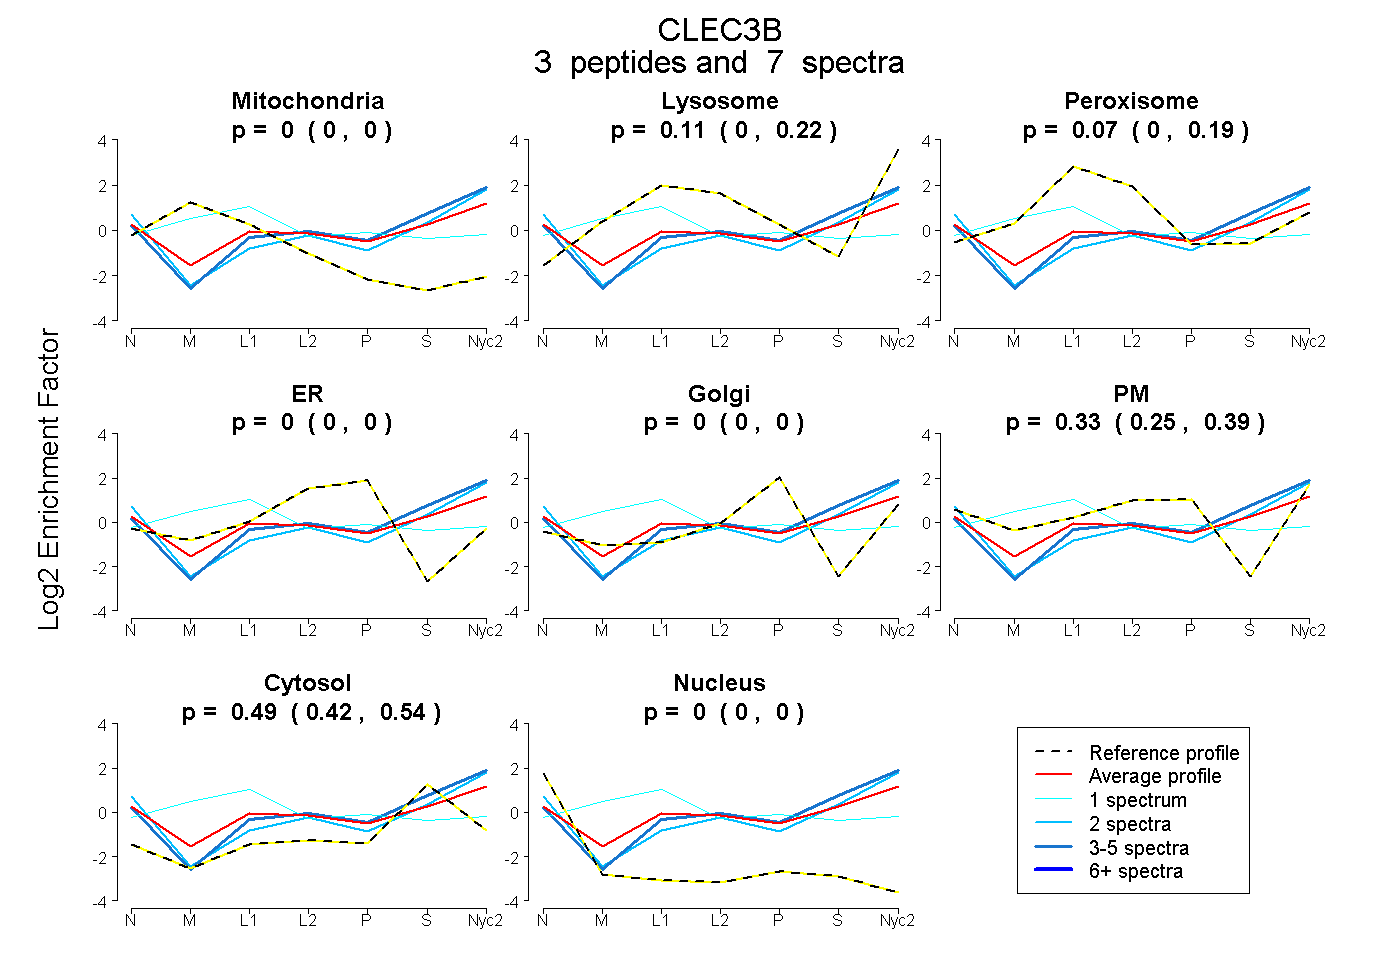
| Plot | Mito | Lyso | Perox | ER | Golgi | PM | Cytosol | Nucleus | |||||
| Expt A |
3 peptides |
7 spectra |
|
0.000 0.000 | 0.000 |
0.108 0.000 | 0.219 |
0.074 0.000 | 0.192 |
0.000 0.000 | 0.000 |
0.000 0.000 | 0.000 |
0.330 0.247 | 0.389 |
0.487 0.422 | 0.536 |
0.000 0.000 | 0.000 |
| 1 spectrum, QALQTVCLK | 0.237 | 0.000 | 0.430 | 0.000 | 0.165 | 0.000 | 0.168 | 0.000 | ||
| 4 spectra, MFEELK | 0.000 | 0.214 | 0.000 | 0.000 | 0.000 | 0.230 | 0.557 | 0.000 | ||
| 2 spectra, LDVLAQEVALLK | 0.000 | 0.052 | 0.000 | 0.000 | 0.000 | 0.398 | 0.550 | 0.000 |
| Plot | Mito | Lyso or Perox | ER | Golgi | PM | Cytosol | Nucleus | ||||||
| Expt B |
1 peptide |
1 spectrum |
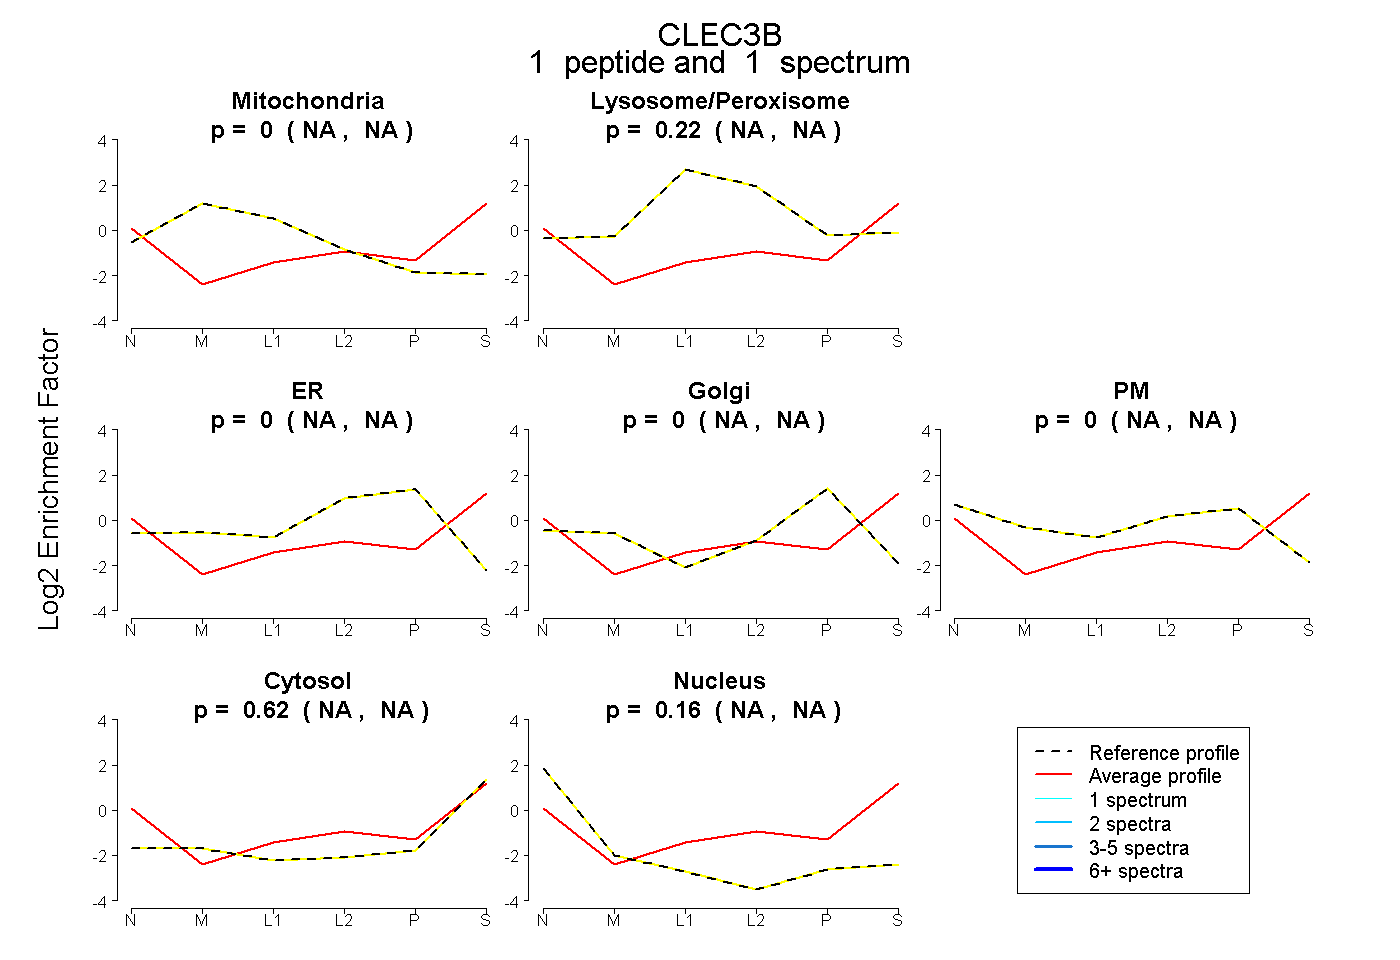 |
0.000 NA | NA |
0.221 NA | NA |
0.000 NA | NA |
0.000 NA | NA |
0.000 NA | NA |
0.620 NA | NA |
0.159 NA | NA |
|||
| Plot | Lyso | Other | |||||||||||
| Expt C |
1 peptide |
1 spectrum |
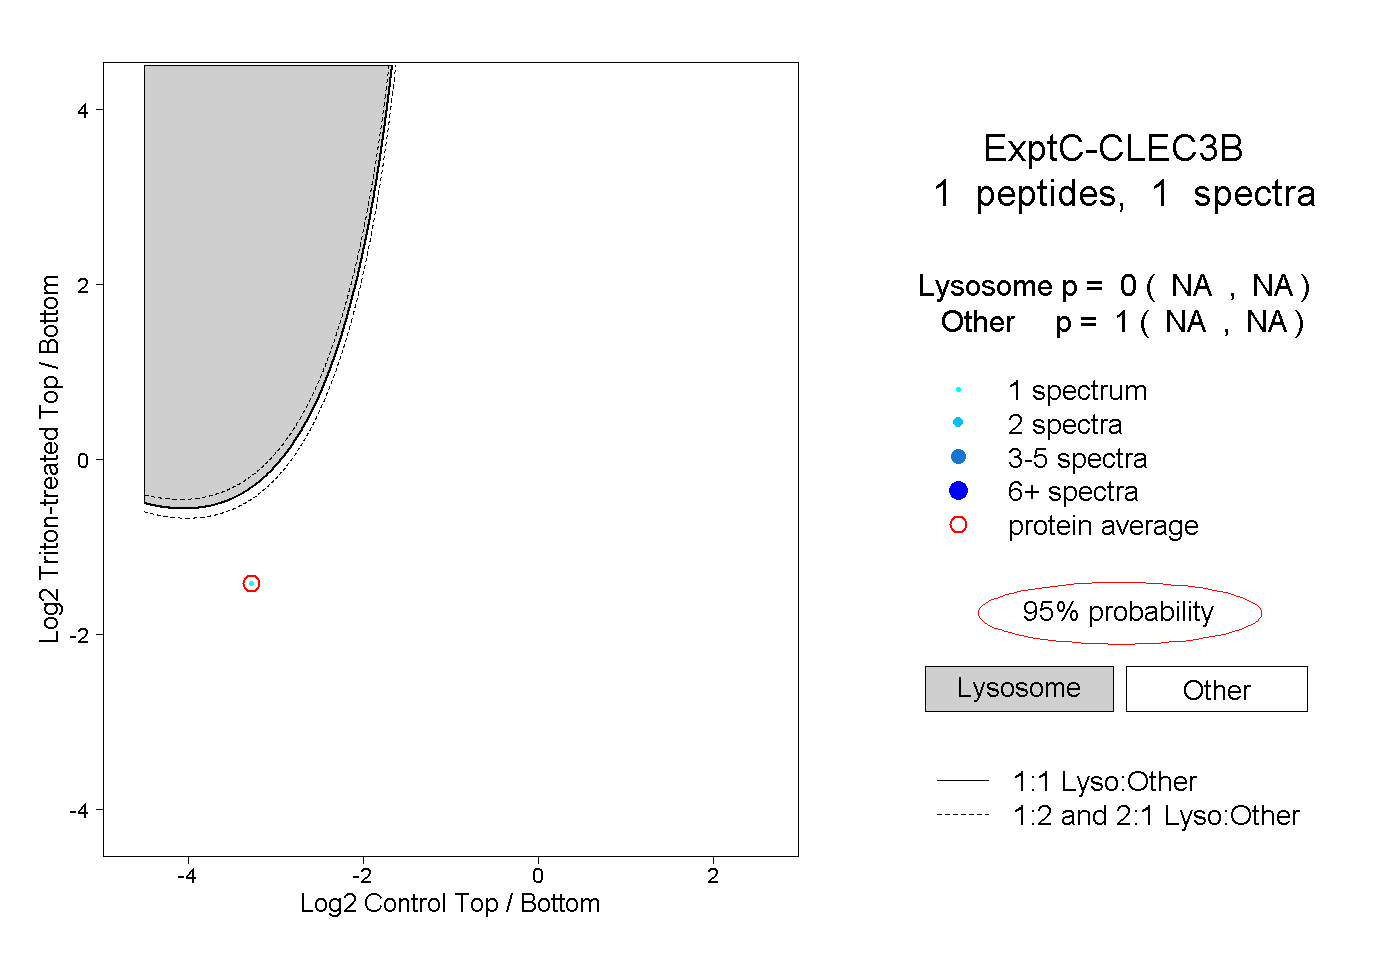 |
0.000 NA | NA |
1.000 NA | NA |