 2
2peptides
spectra
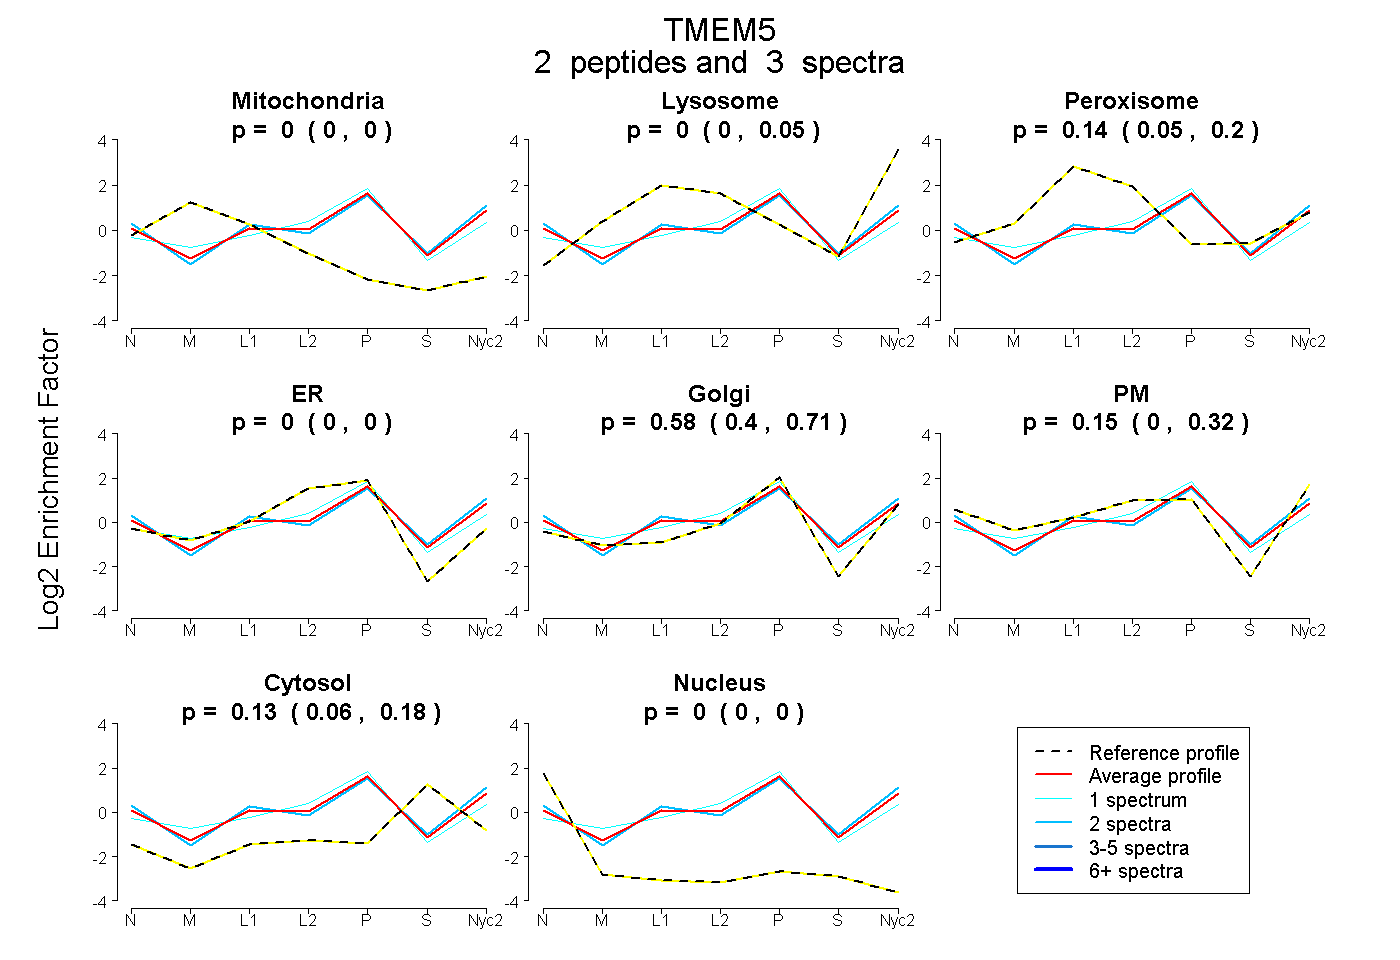
0.000 | 0.000
0.000 | 0.050
0.045 | 0.205
0.000 | 0.000
0.399 | 0.708
0.000 | 0.325
0.064 | 0.181
0.000 | 0.000
| Plot | Mito | Lyso | Perox | ER | Golgi | PM | Cytosol | Nucleus | |||||
| Expt A |
2 peptides |
3 spectra |
|
0.000 0.000 | 0.000 |
0.000 0.000 | 0.050 |
0.144 0.045 | 0.205 |
0.000 0.000 | 0.000 |
0.576 0.399 | 0.708 |
0.153 0.000 | 0.325 |
0.127 0.064 | 0.181 |
0.000 0.000 | 0.000 |
| 1 spectrum, LCWVSAR | 0.000 | 0.000 | 0.136 | 0.176 | 0.603 | 0.000 | 0.085 | 0.000 | ||
| 2 spectra, AMGAPFIFIK | 0.000 | 0.000 | 0.080 | 0.000 | 0.392 | 0.348 | 0.179 | 0.000 |
| Plot | Lyso | Other | |||||||||||
| Expt C |
1 peptide |
1 spectrum |
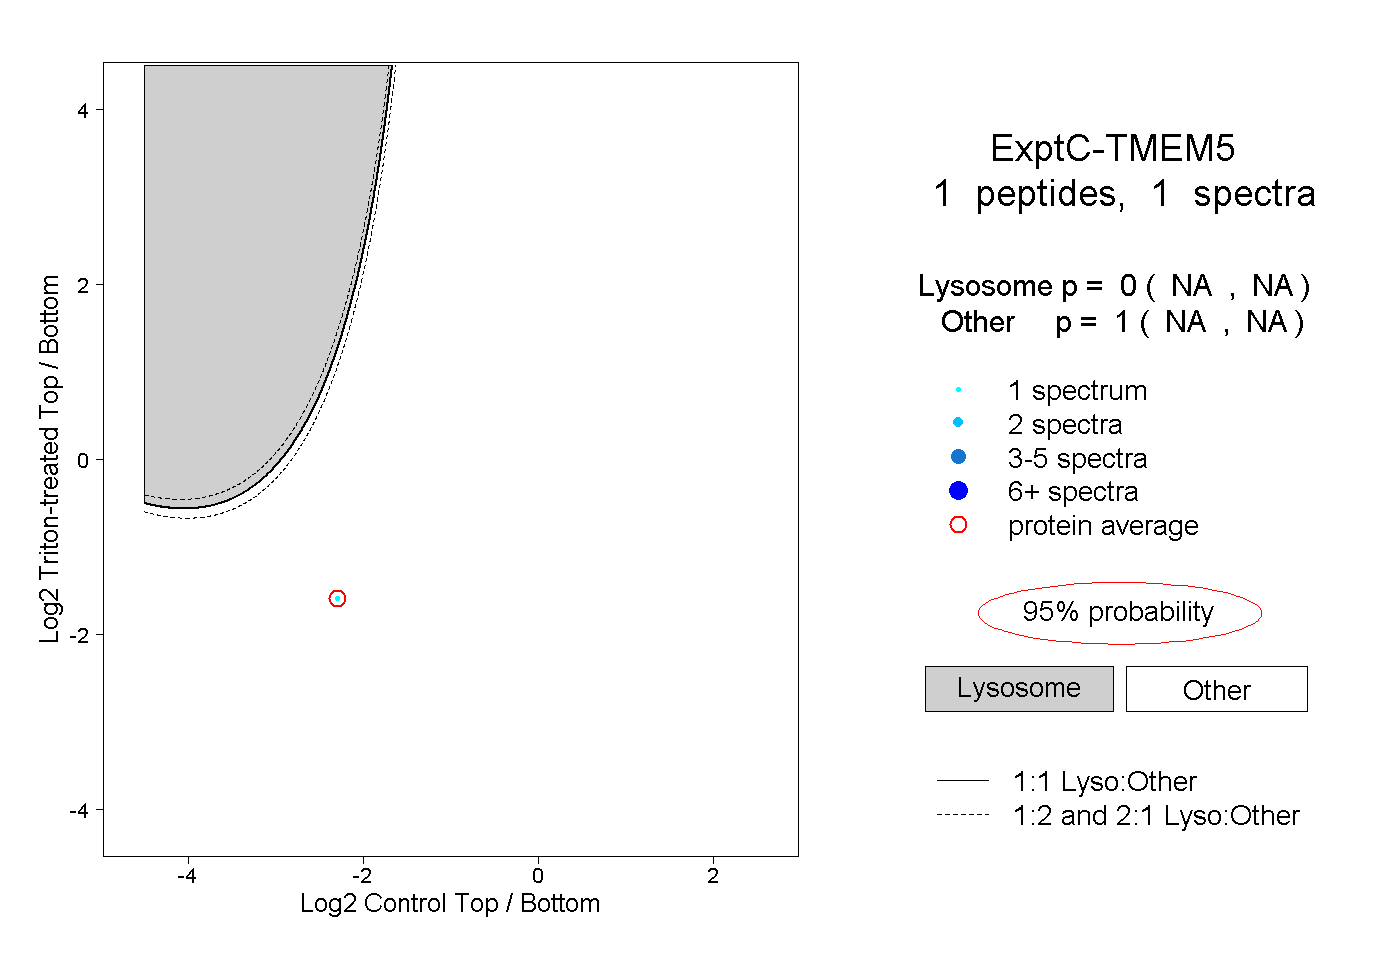 |
0.000 NA | NA |
1.000 NA | NA |