 2
2peptides
spectra
0.000 | 0.432
0.000 | 0.242
0.000 | 0.531
0.000 | 0.478
0.000 | 0.405
0.000 | 0.359
0.000 | 0.399
0.000 | 0.400
| Plot | Mito | Lyso | Perox | ER | Golgi | PM | Cytosol | Nucleus | |||||
| Expt A |
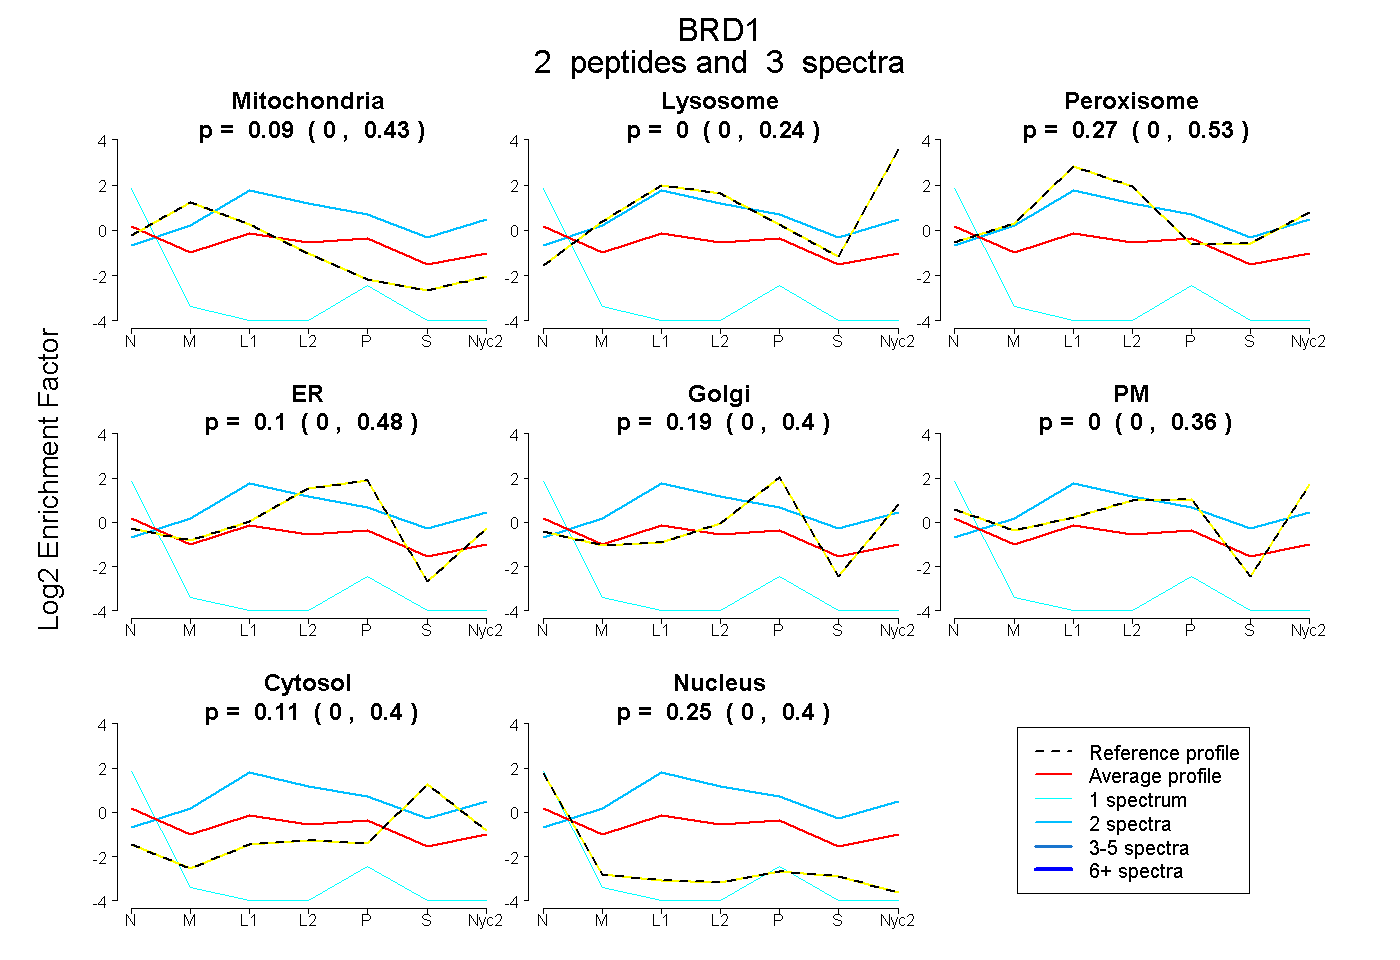
2 peptides |
3 spectra |
|
0.090 0.000 | 0.432 |
0.000 0.000 | 0.242 |
0.265 0.000 | 0.531 |
0.102 0.000 | 0.478 |
0.186 0.000 | 0.405 |
0.000 0.000 | 0.359 |
0.107 0.000 | 0.399 |
0.249 0.000 | 0.400 |