6
6peptides
spectra

0.004 | 0.019
0.460 | 0.520
0.126 | 0.177
0.000 | 0.000
0.000 | 0.000
0.328 | 0.350
0.000 | 0.000
0.000 | 0.000
6peptides
spectra
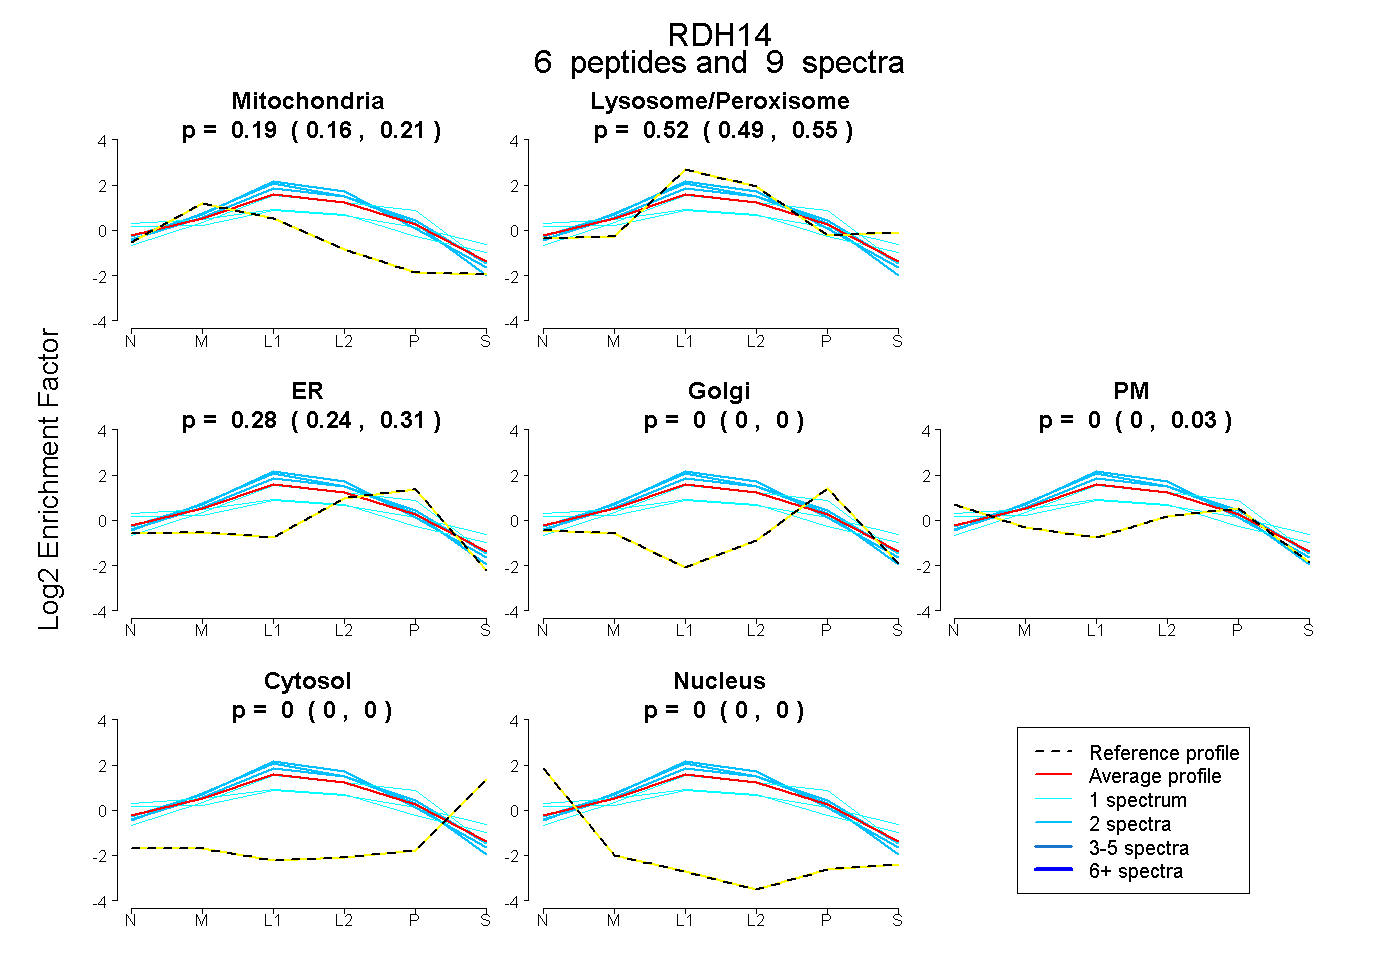
0.164 | 0.212
0.490 | 0.551
0.245 | 0.310
0.000 | 0.000
0.000 | 0.029
0.000 | 0.000
0.000 | 0.000
15peptides
spectra

0.165 | 1.000
0.000 | 0.831