 6
6peptides
spectra

0.004 | 0.019
0.460 | 0.520
0.126 | 0.177
0.000 | 0.000
0.000 | 0.000
0.328 | 0.350
0.000 | 0.000
0.000 | 0.000
| Plot | Mito | Lyso | Perox | ER | Golgi | PM | Cytosol | Nucleus | |||||
| Expt A |
6 peptides |
20 spectra |
|
0.012 0.004 | 0.019 |
0.493 0.460 | 0.520 |
0.155 0.126 | 0.177 |
0.000 0.000 | 0.000 |
0.000 0.000 | 0.000 |
0.340 0.328 | 0.350 |
0.000 0.000 | 0.000 |
0.000 0.000 | 0.000 |
| 6 spectra, VIMGCR | 0.076 | 0.385 | 0.225 | 0.000 | 0.023 | 0.291 | 0.000 | 0.000 | ||
| 2 spectra, AEEAAGQLR | 0.000 | 0.665 | 0.085 | 0.000 | 0.000 | 0.250 | 0.000 | 0.000 | ||
| 2 spectra, ATAGELLR | 0.013 | 0.668 | 0.000 | 0.000 | 0.000 | 0.319 | 0.000 | 0.000 | ||
| 2 spectra, AFCQELLQEEPR | 0.010 | 0.068 | 0.492 | 0.000 | 0.000 | 0.430 | 0.000 | 0.000 | ||
| 2 spectra, TVLITGANSGLGR | 0.004 | 0.661 | 0.000 | 0.000 | 0.000 | 0.334 | 0.000 | 0.000 | ||
| 6 spectra, AMDESVAR | 0.000 | 0.515 | 0.149 | 0.000 | 0.000 | 0.337 | 0.000 | 0.000 |
| Plot | Mito | Lyso or Perox | ER | Golgi | PM | Cytosol | Nucleus | ||||||
| Expt B |
6 peptides |
9 spectra |
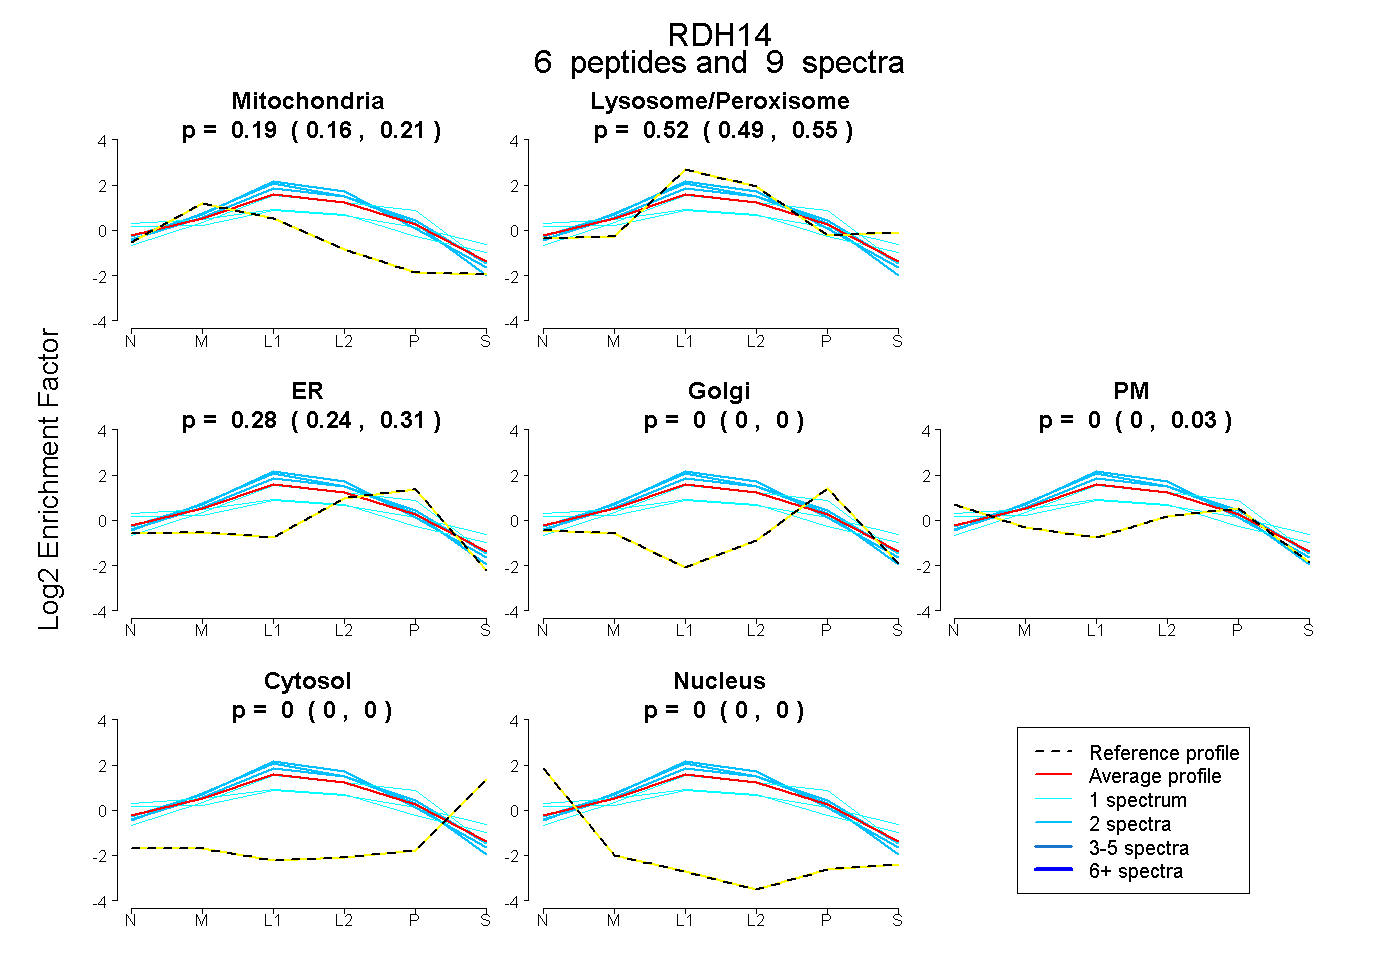 |
0.192 0.164 | 0.212 |
0.523 0.490 | 0.551 |
0.285 0.245 | 0.310 |
0.000 0.000 | 0.000 |
0.000 0.000 | 0.029 |
0.000 0.000 | 0.000 |
0.000 0.000 | 0.000 |
|||
| Plot | Lyso | Other | |||||||||||
| Expt C |
15 peptides |
90 spectra |
 |
0.945 0.165 | 1.000 |
0.055 0.000 | 0.831 |
||||||||
| Plot | Lyso | Other | |||||||||||
| Expt D |
5 peptides |
9 spectra |
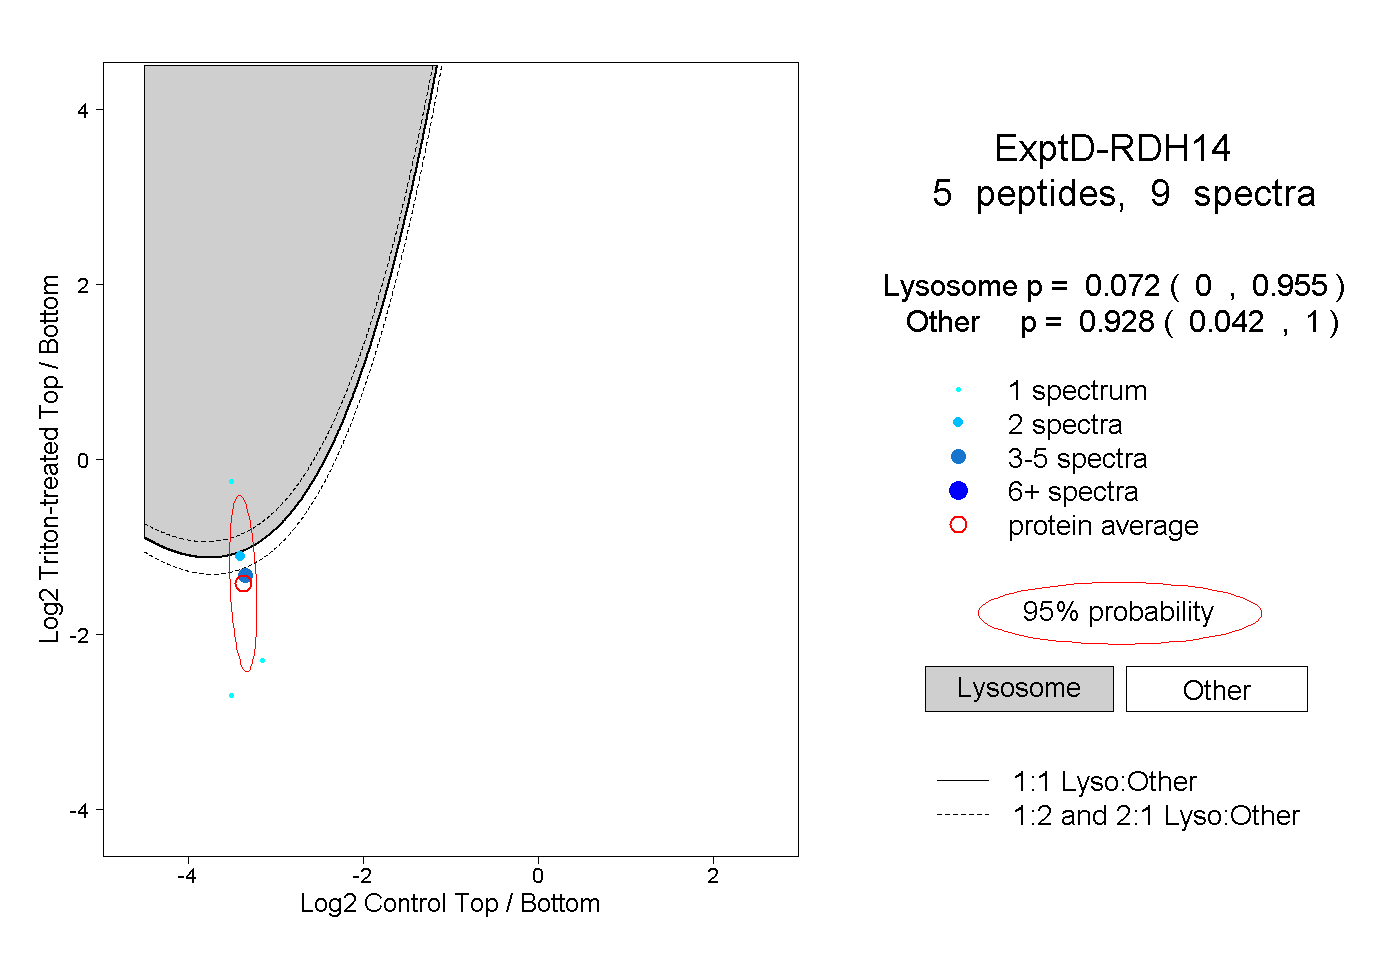 |
0.072 0.000 | 0.955 |
0.928 0.042 | 1.000 |