 5
5peptides
spectra
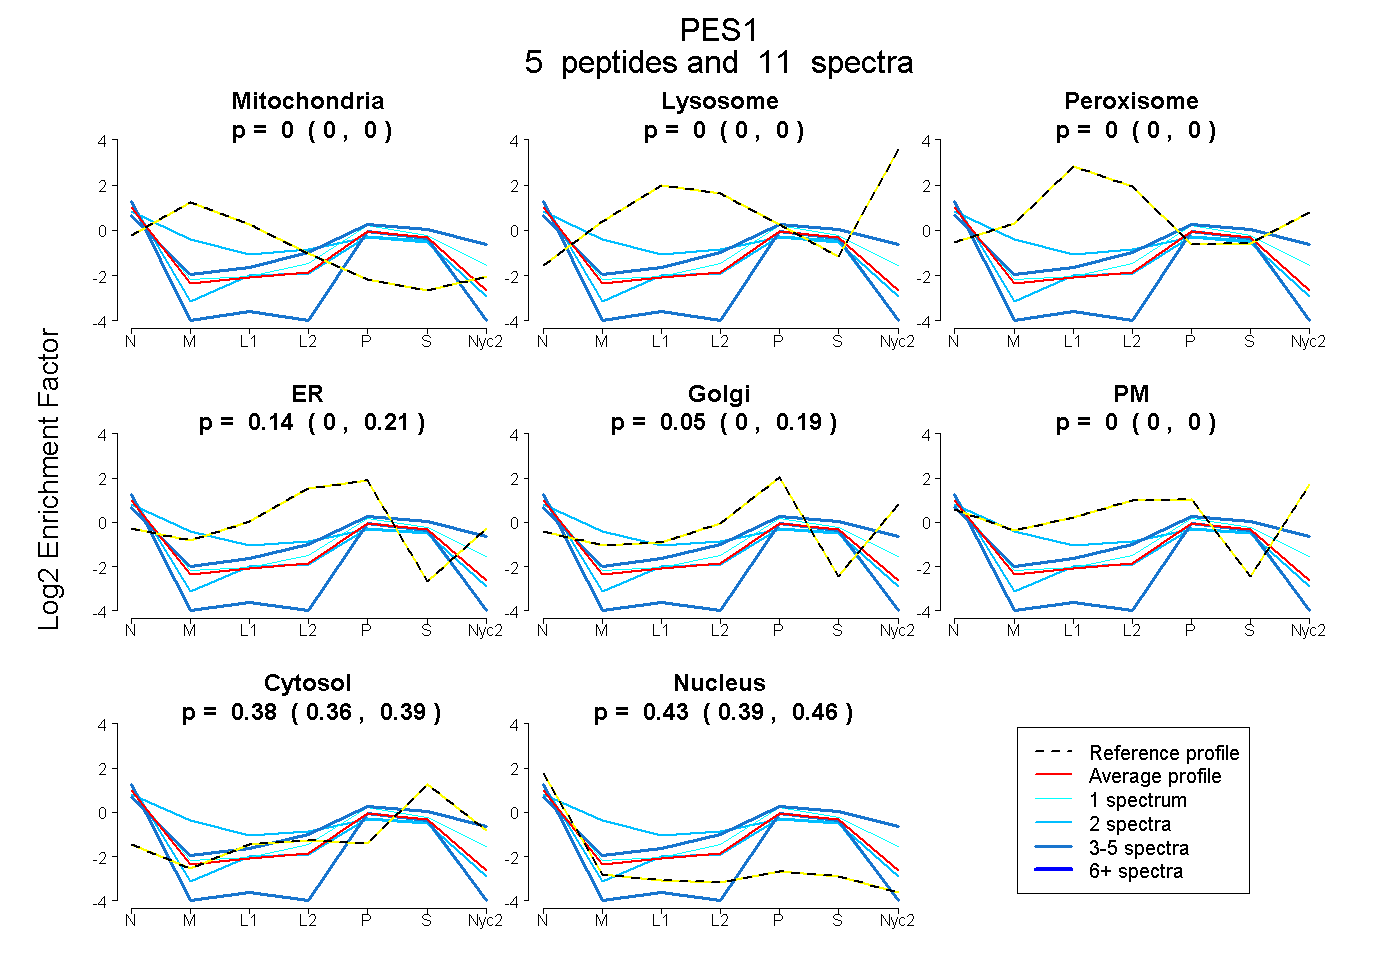
0.000 | 0.000
0.000 | 0.000
0.000 | 0.000
0.000 | 0.206
0.000 | 0.186
0.000 | 0.000
0.355 | 0.394
0.393 | 0.462
2peptides
spectra
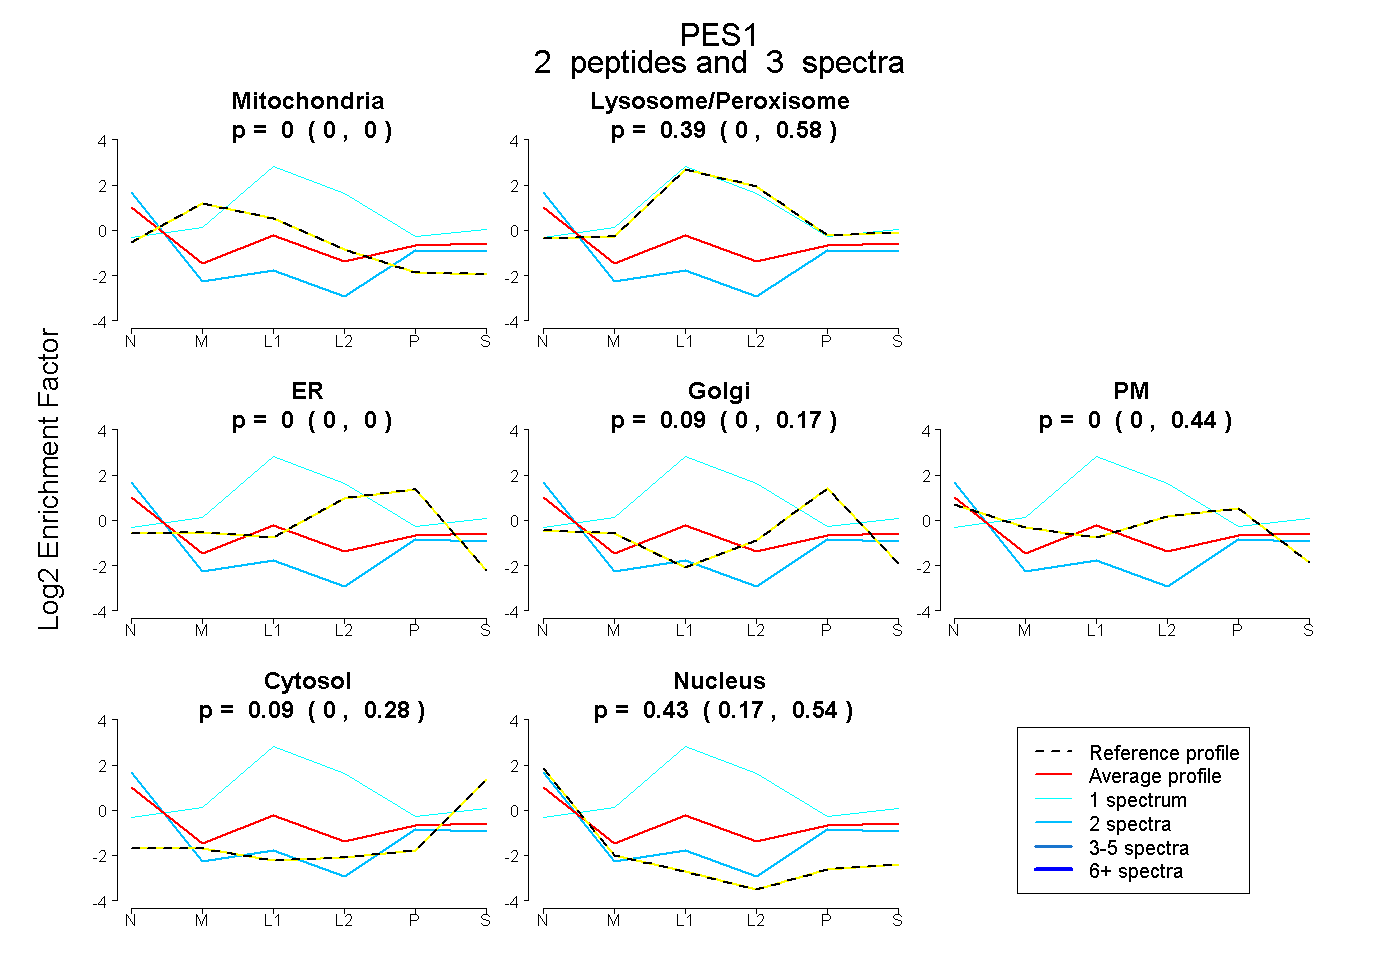
0.000 | 0.000
0.000 | 0.583
0.000 | 0.000
0.000 | 0.168
0.000 | 0.444
0.000 | 0.278
0.171 | 0.537
1peptide
spectra
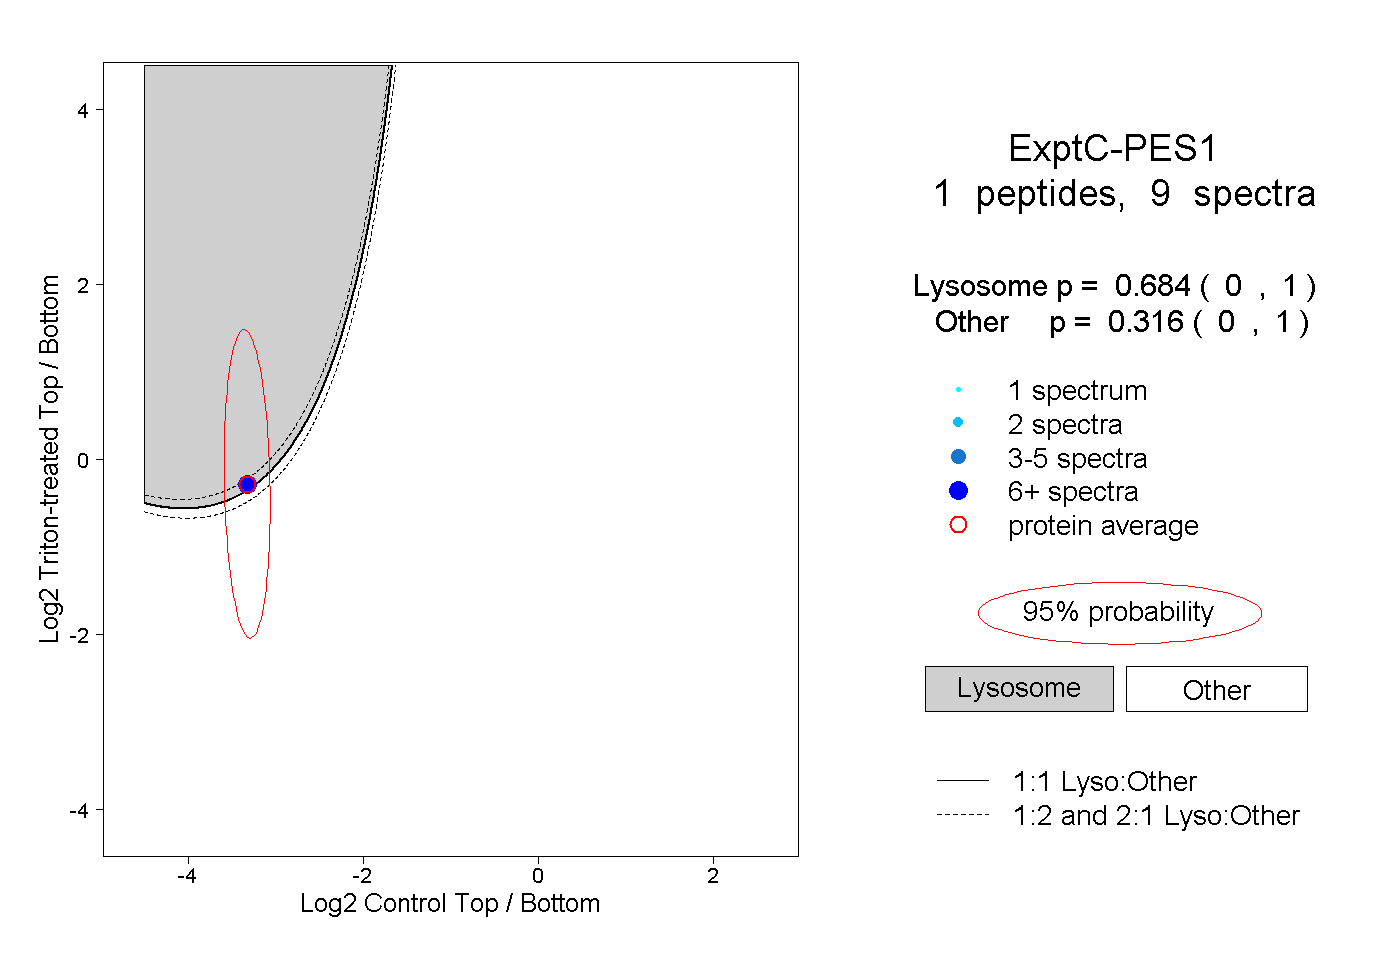
0.000 | 1.000
0.000 | 1.000