 1
1peptide
spectrum
NA | NA
NA | NA
NA | NA
NA | NA
NA | NA
NA | NA
NA | NA
NA | NA
2peptides
spectra
NA | NA
NA | NA
NA | NA
NA | NA
NA | NA
NA | NA
NA | NA
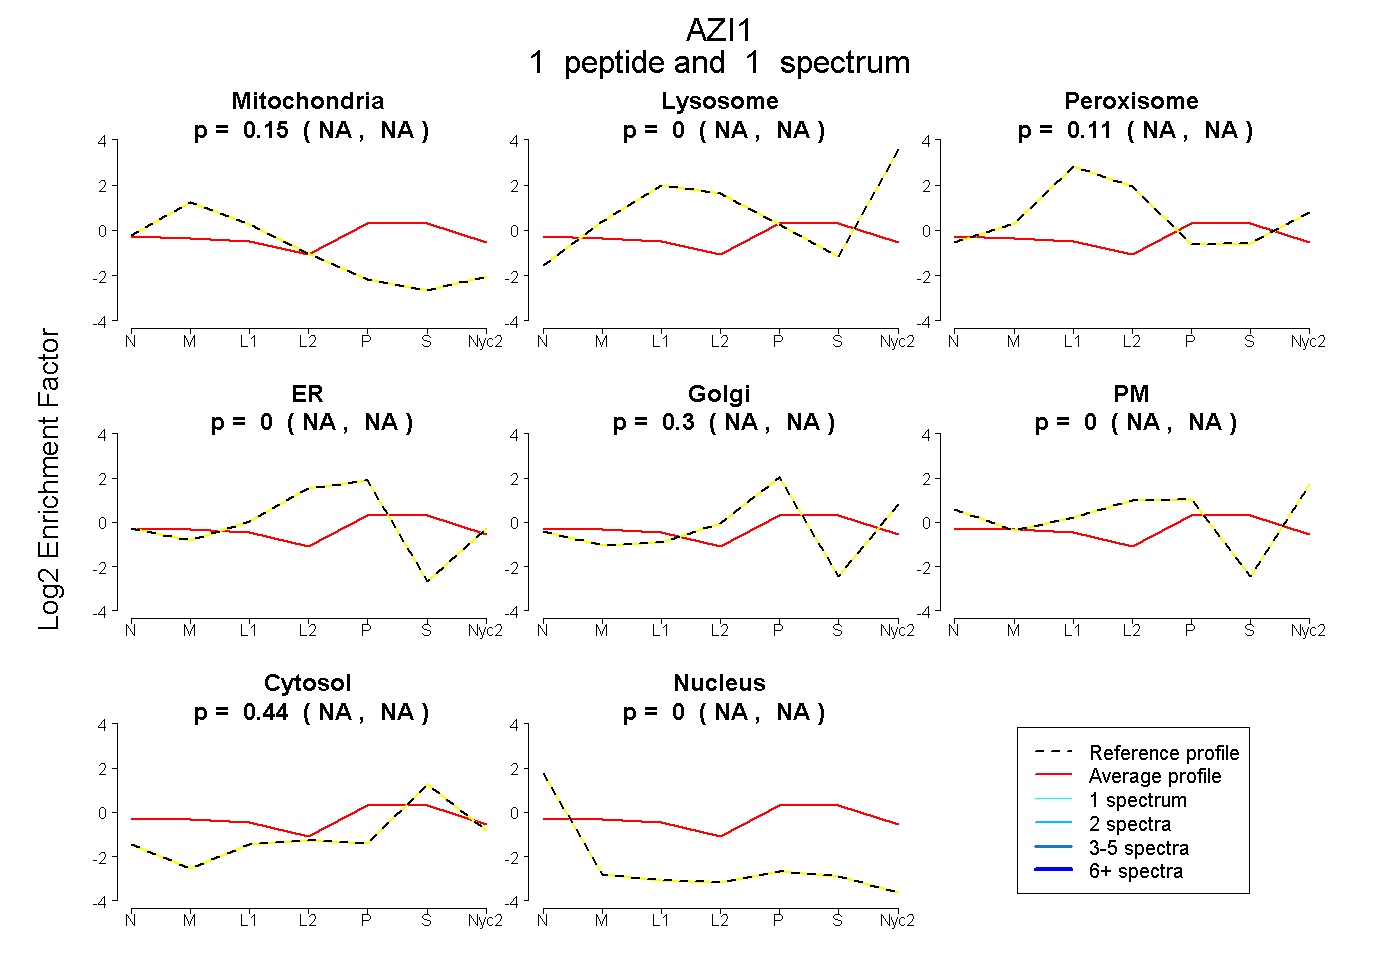
| Plot | Mito | Lyso | Perox | ER | Golgi | PM | Cytosol | Nucleus | |||||
| Expt A |
1 peptide |
1 spectrum |
|
0.151 NA | NA |
0.000 NA | NA |
0.113 NA | NA |
0.000 NA | NA |
0.295 NA | NA |
0.000 NA | NA |
0.440 NA | NA |
0.000 NA | NA |
||
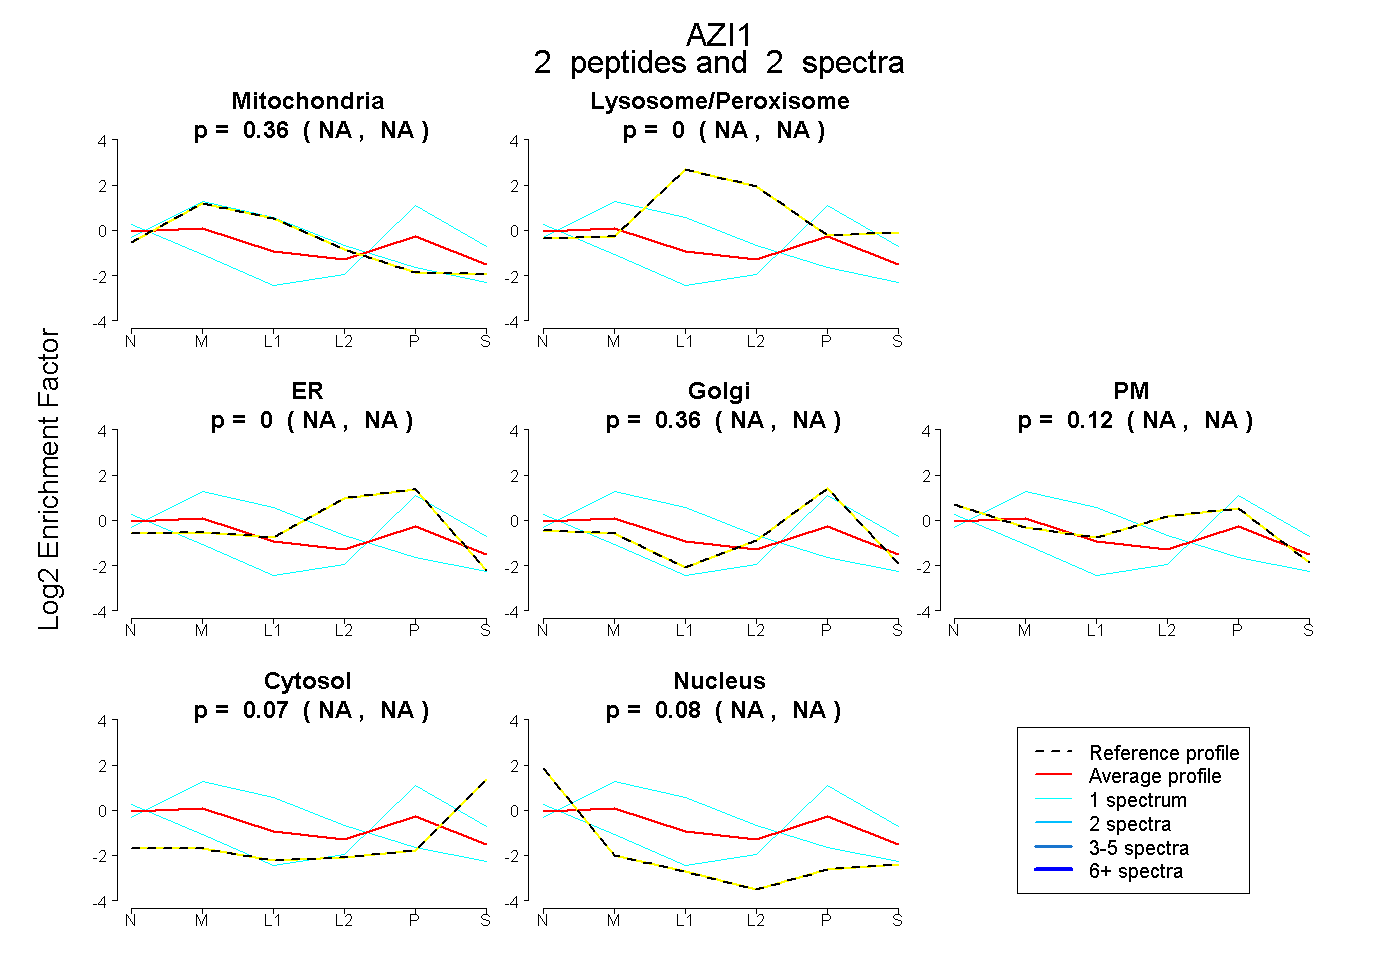
| Plot | Mito | Lyso or Perox | ER | Golgi | PM | Cytosol | Nucleus | ||||||
| Expt B |
2 peptides |
2 spectra |
|
0.364 NA | NA |
0.000 NA | NA |
0.000 NA | NA |
0.356 NA | NA |
0.124 NA | NA |
0.073 NA | NA |
0.083 NA | NA |
| 1 spectrum, LGQQAAR | 0.938 | 0.000 | 0.010 | 0.000 | 0.052 | 0.000 | 0.000 | |||
| 1 spectrum, ATLDDLLDTLK | 0.000 | 0.000 | 0.000 | 0.706 | 0.000 | 0.175 | 0.119 |