 5
5peptides
spectra
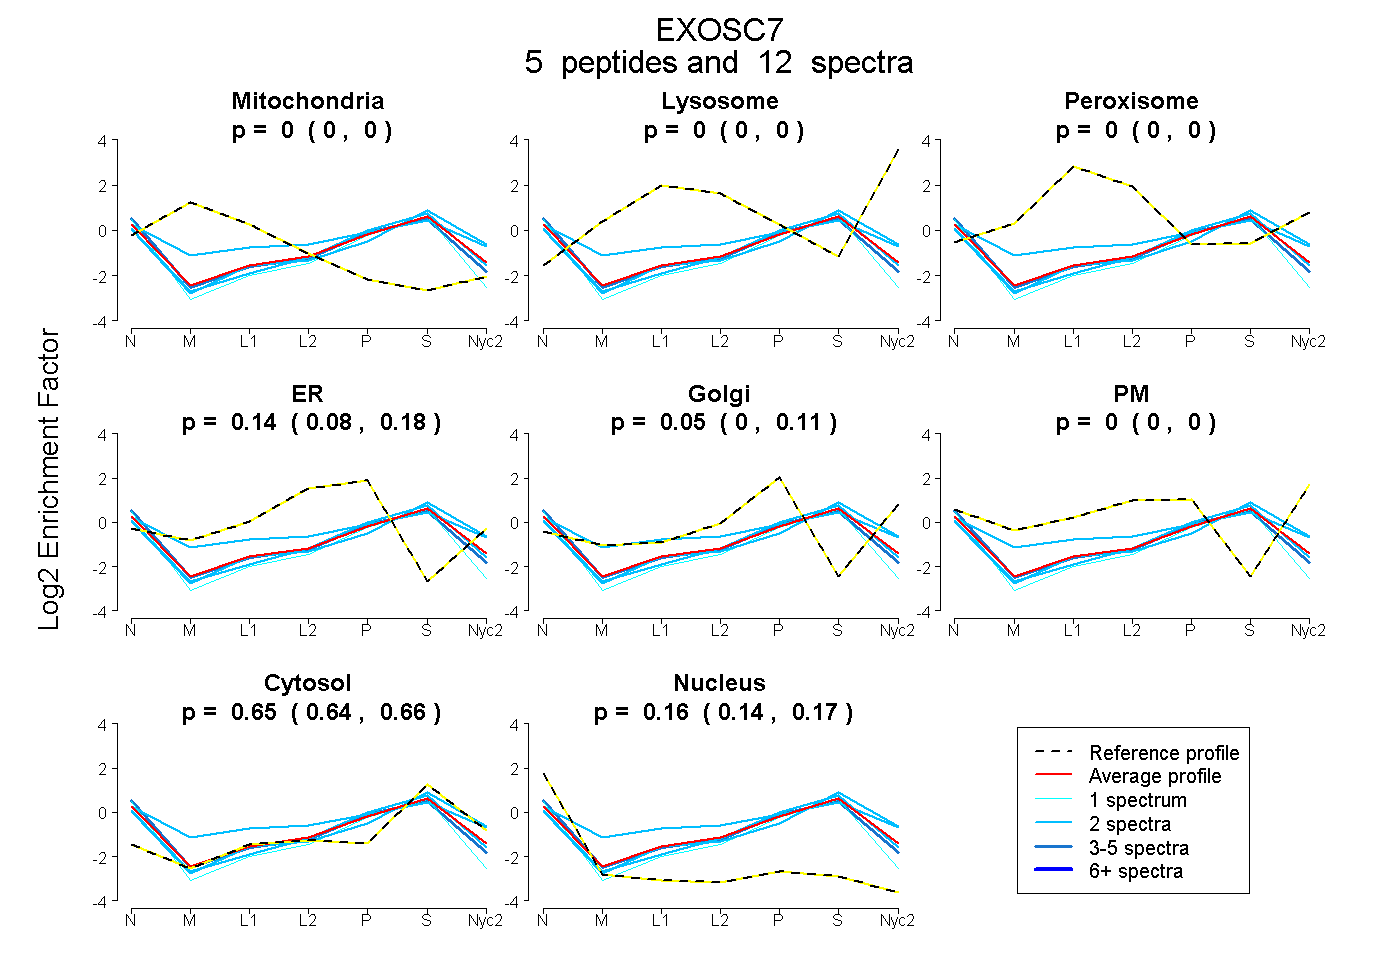
0.000 | 0.000
0.000 | 0.000
0.000 | 0.000
0.078 | 0.180
0.000 | 0.111
0.000 | 0.000
0.636 | 0.658
0.143 | 0.174
2peptides
spectra

NA | NA
NA | NA
| Plot | Mito | Lyso | Perox | ER | Golgi | PM | Cytosol | Nucleus | |||||
| Expt A |
5 peptides |
12 spectra |
|
0.000 0.000 | 0.000 |
0.000 0.000 | 0.000 |
0.000 0.000 | 0.000 |
0.136 0.078 | 0.180 |
0.055 0.000 | 0.111 |
0.000 0.000 | 0.000 |
0.649 0.636 | 0.658 |
0.161 0.143 | 0.174 |
||
| Plot | Lyso | Other | |||||||||||
| Expt C |
2 peptides |
2 spectra |
|
0.000 NA | NA |
1.000 NA | NA |