 7
7peptides
spectra
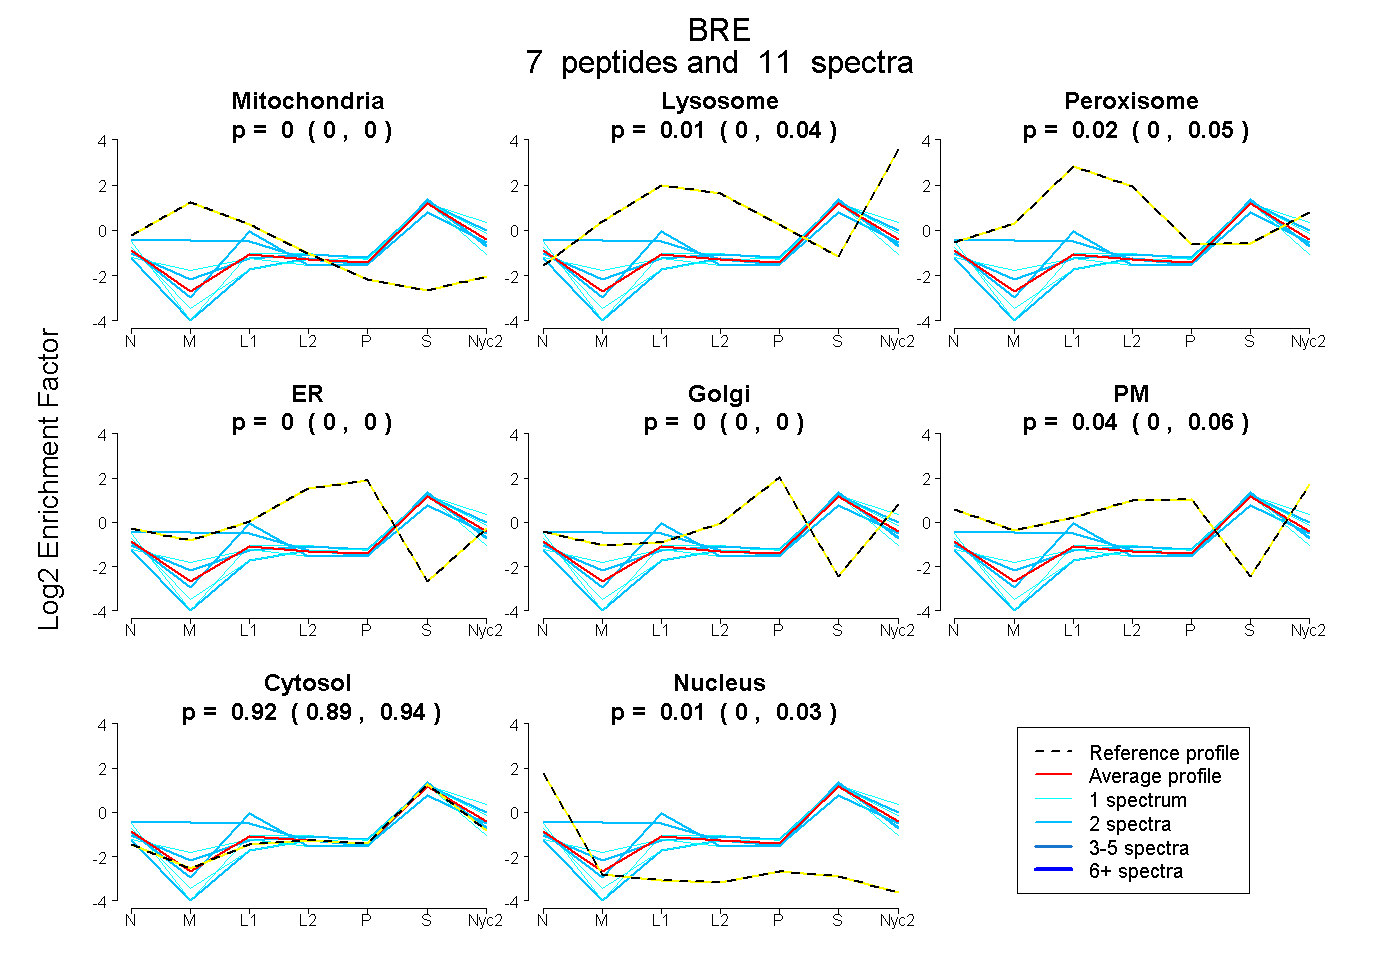
0.000 | 0.000
0.000 | 0.042
0.000 | 0.048
0.000 | 0.000
0.000 | 0.000
0.003 | 0.056
0.890 | 0.943
0.000 | 0.025
1peptide
spectrum
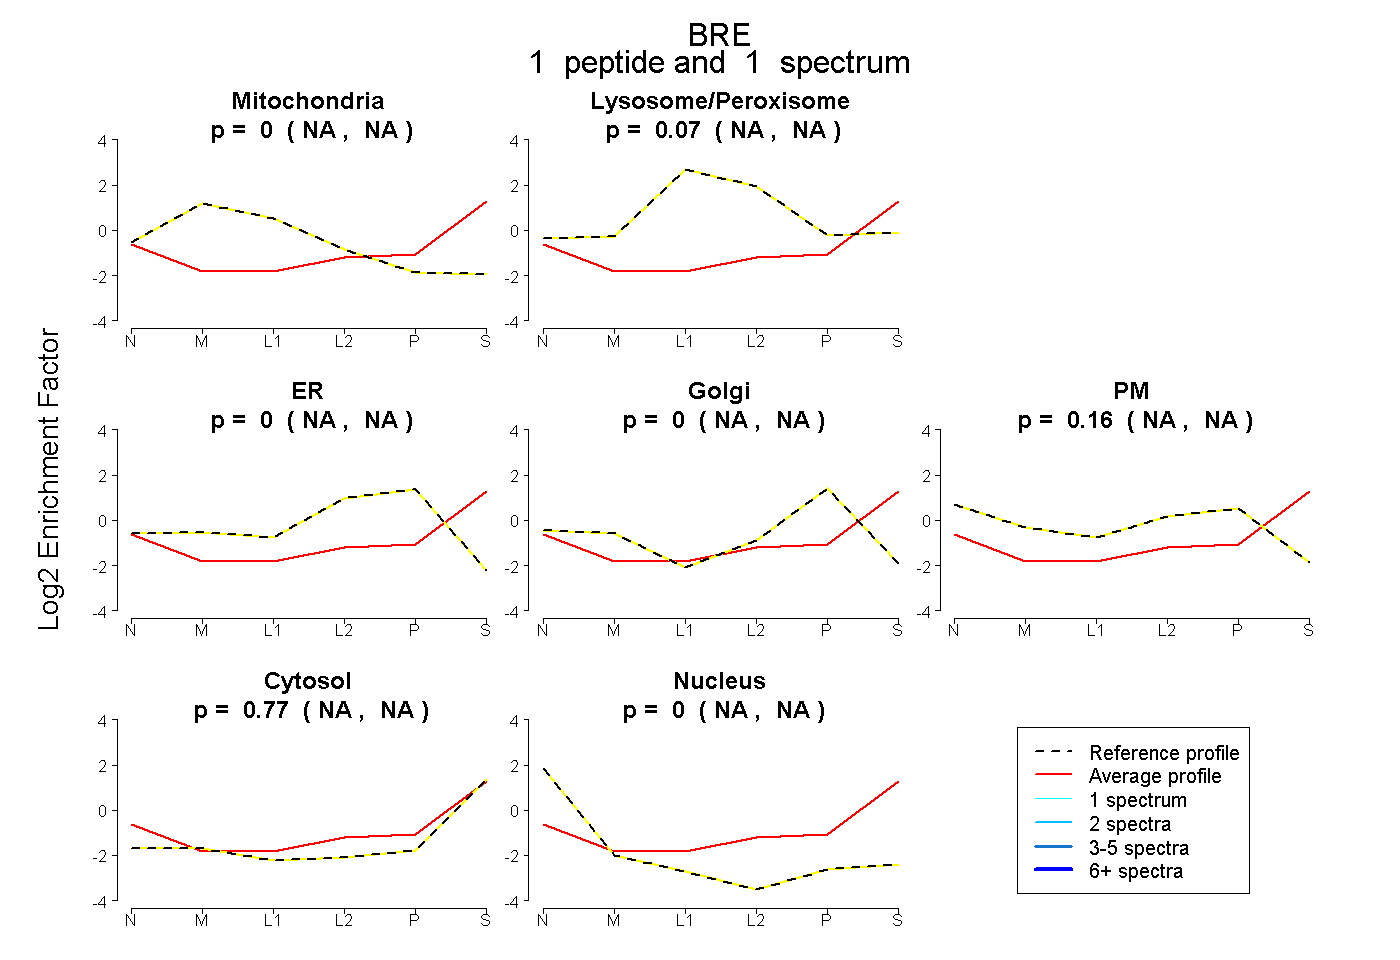
NA | NA
NA | NA
NA | NA
NA | NA
NA | NA
NA | NA
NA | NA
5peptides
spectra
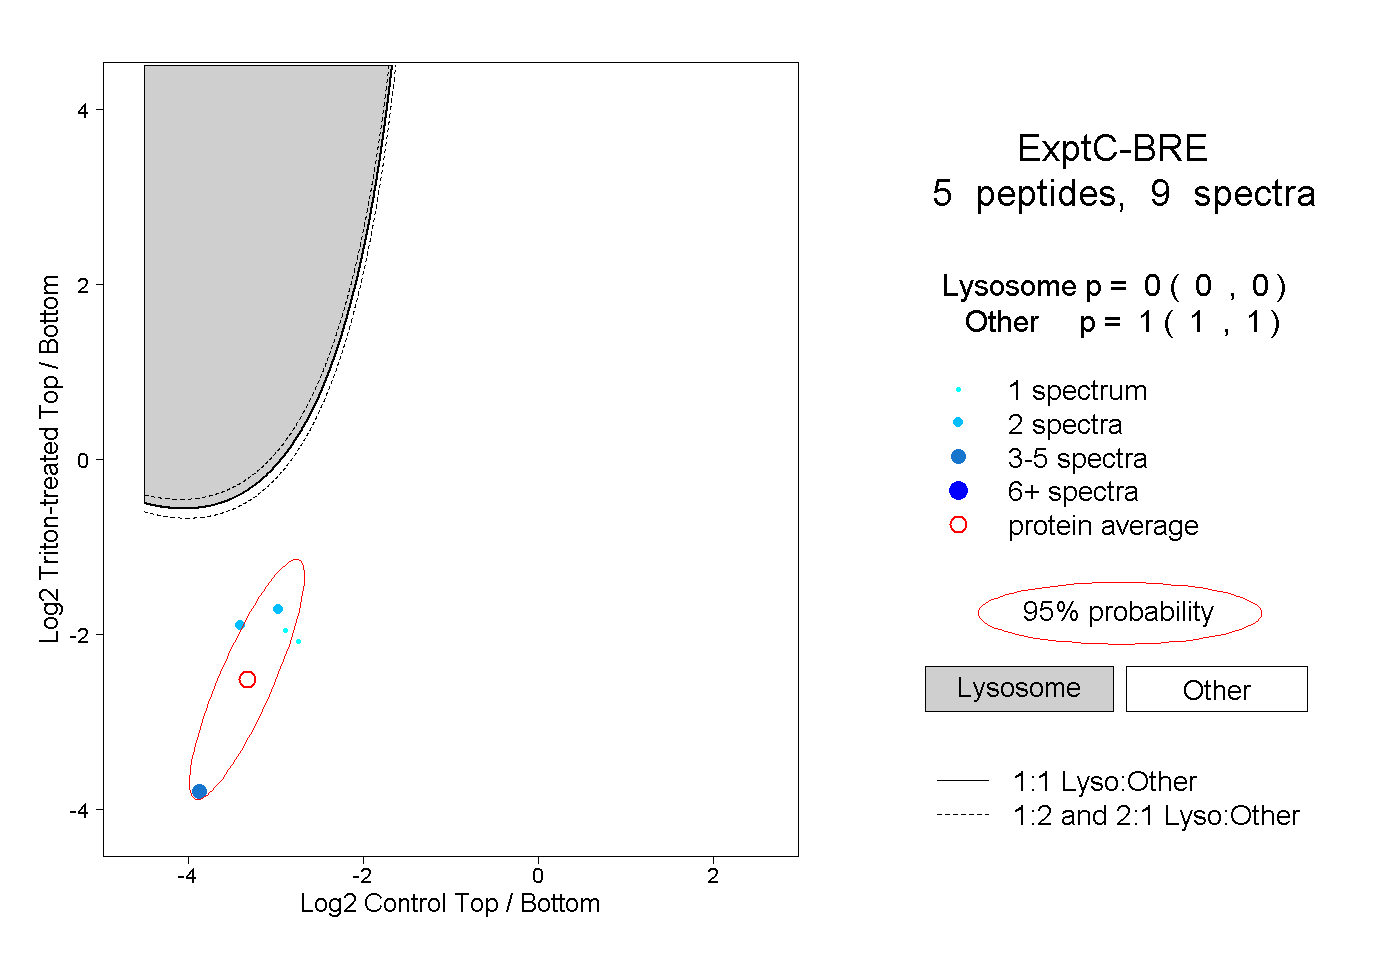
0.000 | 0.000
1.000 | 1.000
1peptide
spectrum
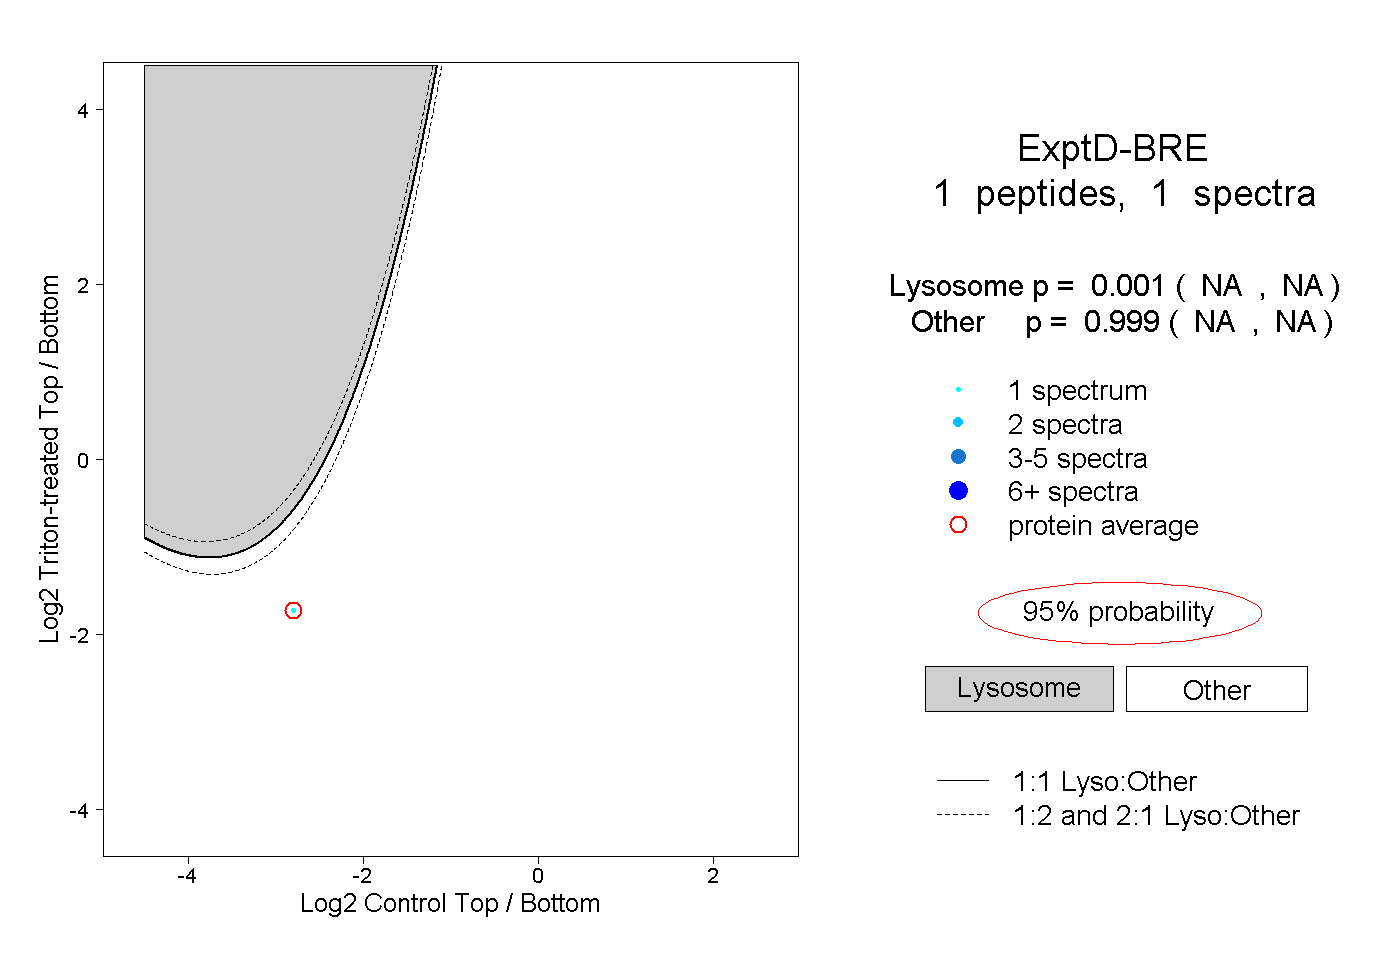
NA | NA
NA | NA