 7
7peptides
spectra
0.000 | 0.000
0.000 | 0.042
0.000 | 0.048
0.000 | 0.000
0.000 | 0.000
0.003 | 0.056
0.890 | 0.943
0.000 | 0.025
| Plot | Mito | Lyso | Perox | ER | Golgi | PM | Cytosol | Nucleus | |||||
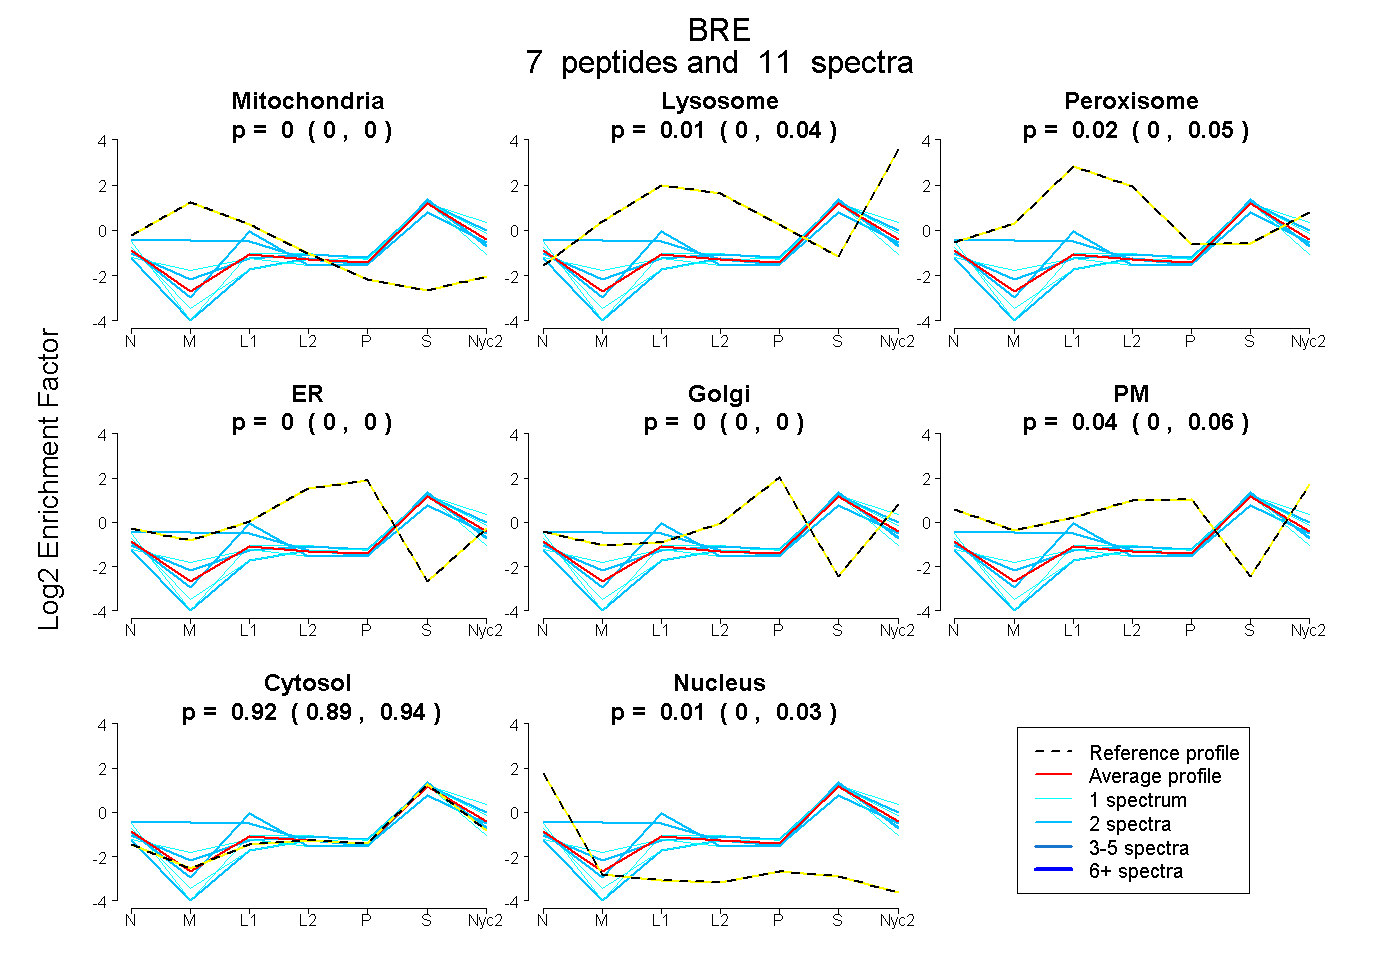
| Expt A |
7 peptides |
11 spectra |
|
0.000 0.000 | 0.000 |
0.009 0.000 | 0.042 |
0.018 0.000 | 0.048 |
0.000 0.000 | 0.000 |
0.000 0.000 | 0.000 |
0.039 0.003 | 0.056 |
0.922 0.890 | 0.943 |
0.012 0.000 | 0.025 |
| 2 spectra, LHIPYAGETLK | 0.255 | 0.033 | 0.100 | 0.000 | 0.000 | 0.000 | 0.612 | 0.000 | ||
| 2 spectra, VGLDATNCLR | 0.000 | 0.000 | 0.105 | 0.000 | 0.000 | 0.000 | 0.879 | 0.016 | ||
| 2 spectra, ELVQQYHQFQCGR | 0.000 | 0.000 | 0.000 | 0.000 | 0.000 | 0.000 | 0.984 | 0.016 | ||
| 1 spectrum, SPEIALNR | 0.033 | 0.075 | 0.000 | 0.000 | 0.000 | 0.000 | 0.892 | 0.000 | ||
| 1 spectrum, SGCTSLTPGPNCDR | 0.000 | 0.000 | 0.000 | 0.000 | 0.000 | 0.000 | 0.922 | 0.078 | ||
| 1 spectrum, ISPMLSPFISSVVR | 0.000 | 0.000 | 0.000 | 0.000 | 0.000 | 0.079 | 0.921 | 0.000 | ||
| 2 spectra, NNWTGEFSAR | 0.000 | 0.088 | 0.000 | 0.000 | 0.000 | 0.029 | 0.883 | 0.000 |
| Plot | Mito | Lyso or Perox | ER | Golgi | PM | Cytosol | Nucleus | ||||||
| Expt B |
1 peptide |
1 spectrum |
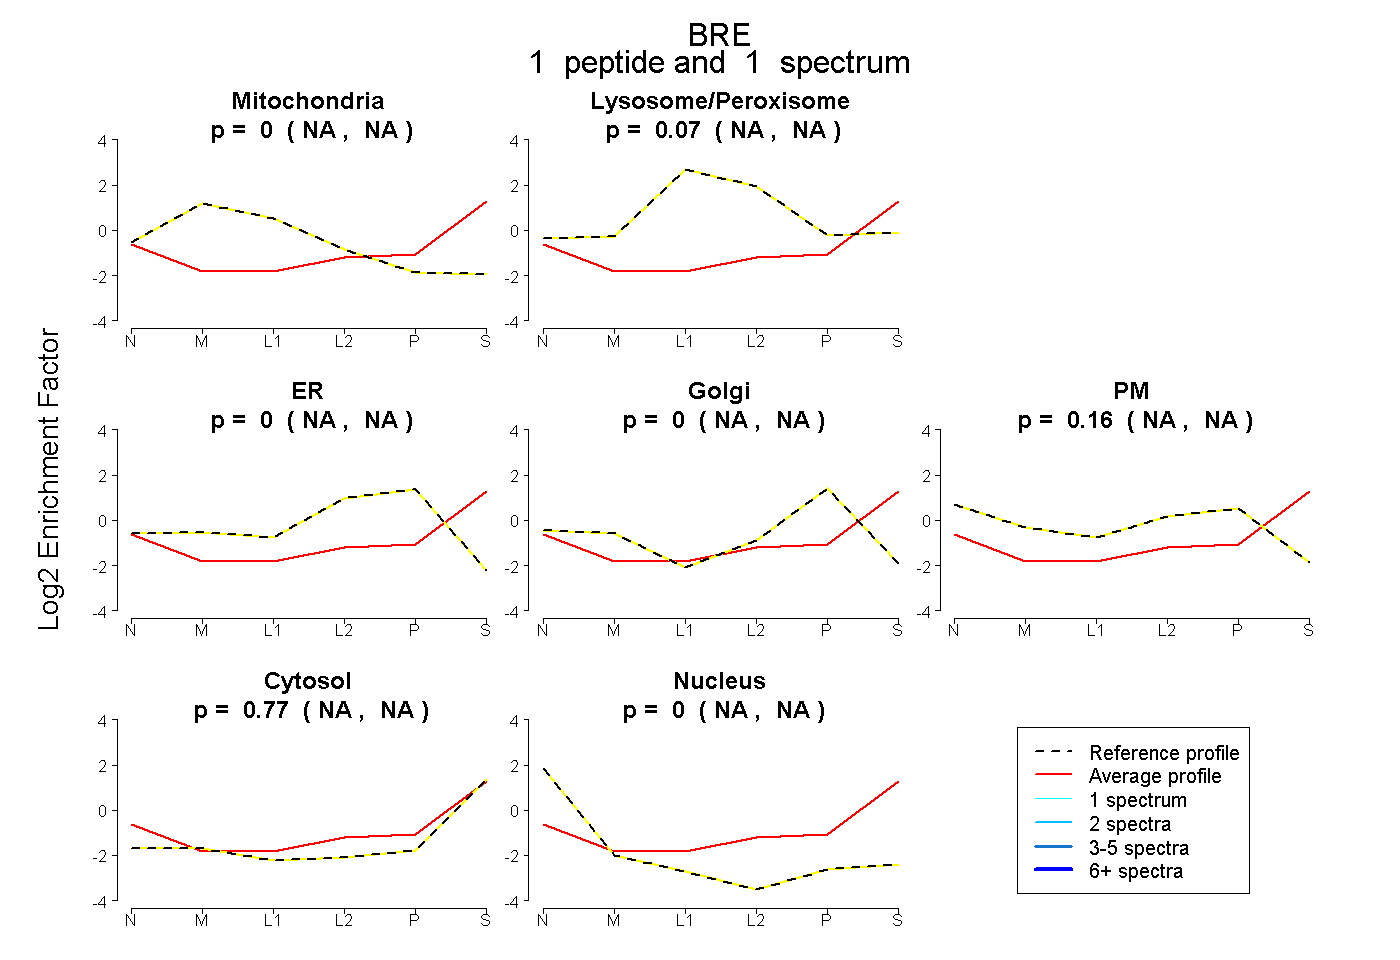 |
0.000 NA | NA |
0.070 NA | NA |
0.000 NA | NA |
0.000 NA | NA |
0.158 NA | NA |
0.772 NA | NA |
0.000 NA | NA |
|||
| Plot | Lyso | Other | |||||||||||
| Expt C |
5 peptides |
9 spectra |
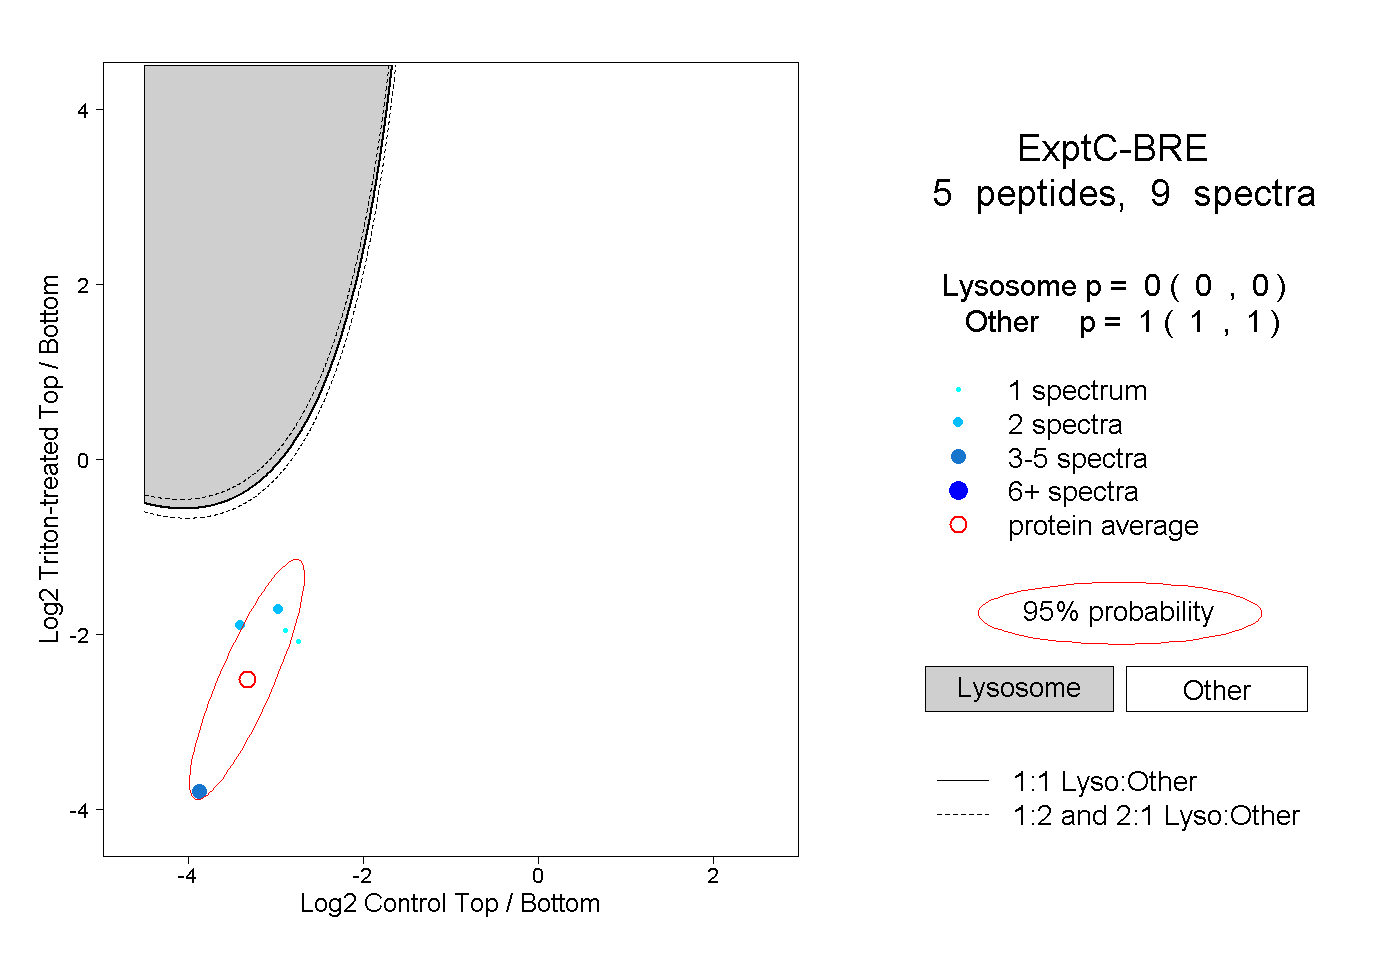 |
0.000 0.000 | 0.000 |
1.000 1.000 | 1.000 |
||||||||
| Plot | Lyso | Other | |||||||||||
| Expt D |
1 peptide |
1 spectrum |
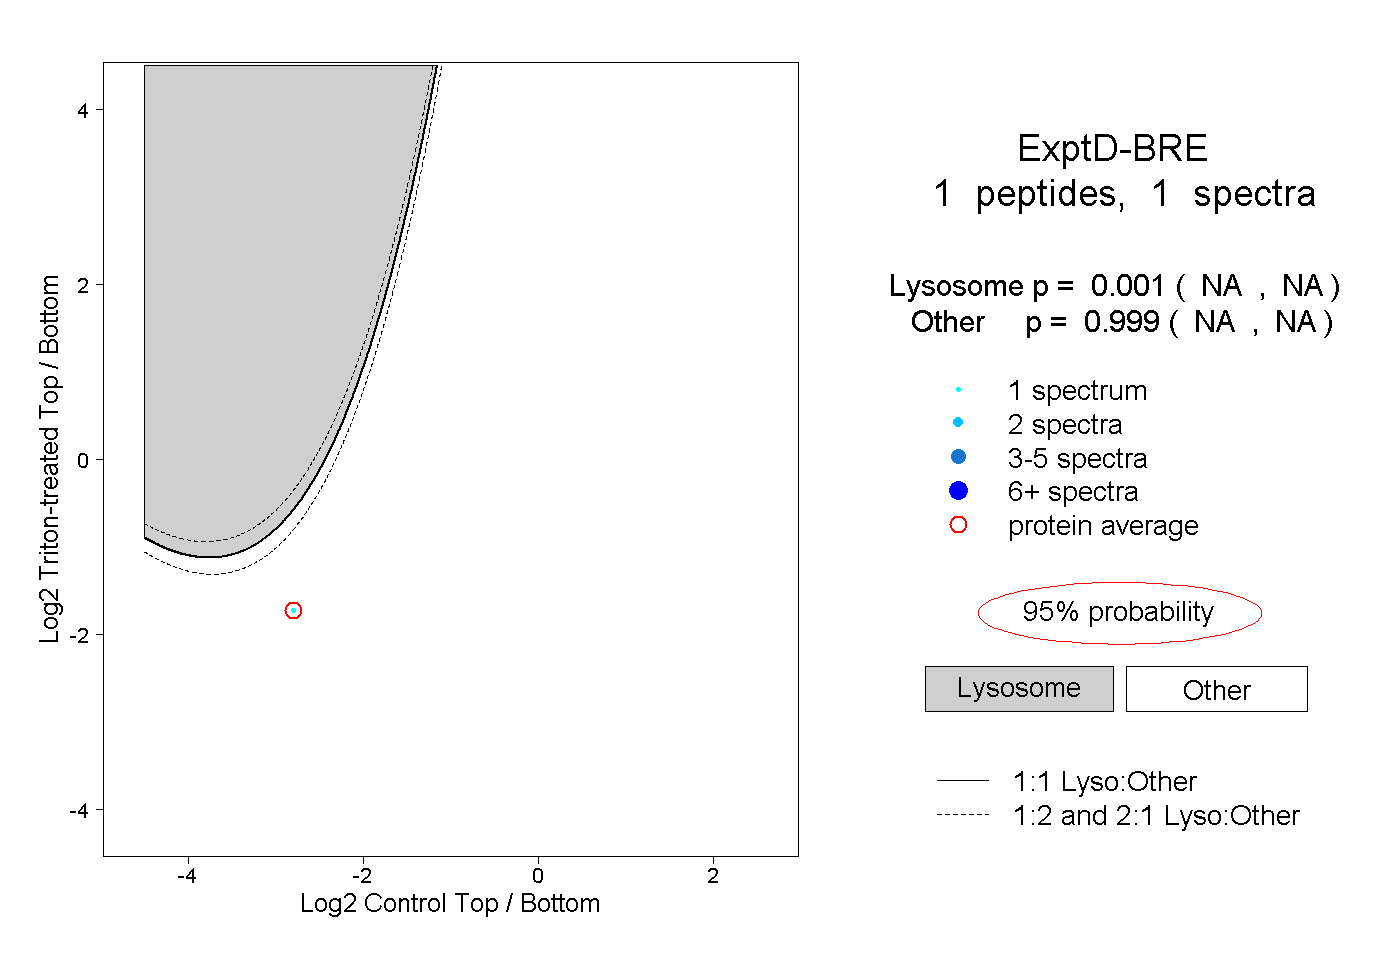 |
0.001 NA | NA |
0.999 NA | NA |