21
21peptides
spectra

0.000 | 0.000
0.015 | 0.032
0.000 | 0.017
0.243 | 0.268
0.601 | 0.631
0.022 | 0.042
0.058 | 0.066
0.000 | 0.000
12peptides
spectra
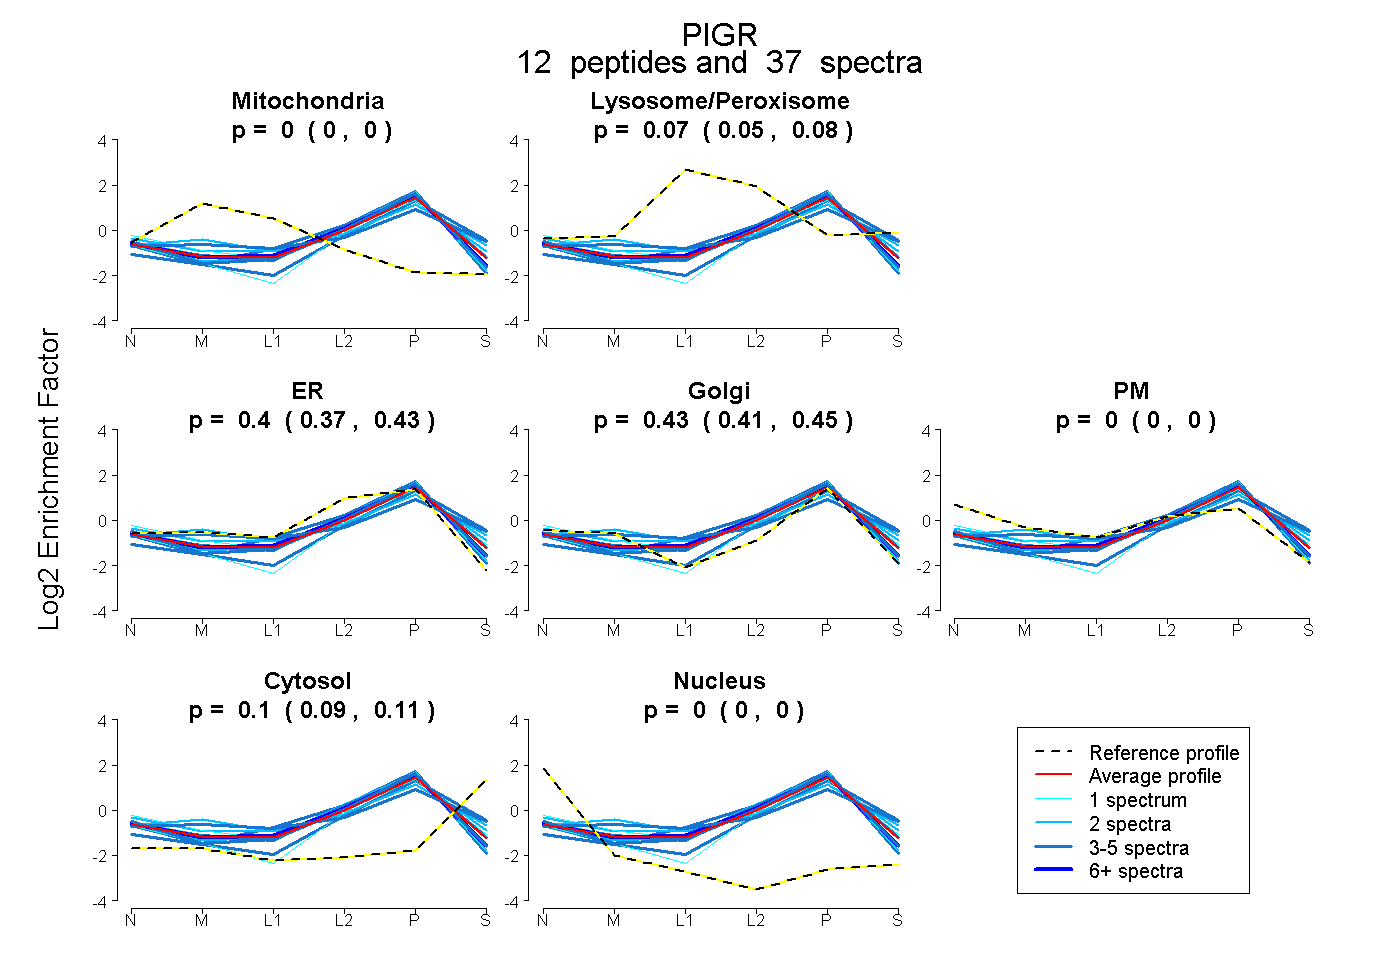
0.000 | 0.000
0.053 | 0.075
0.375 | 0.426
0.413 | 0.451
0.000 | 0.000
0.090 | 0.105
0.000 | 0.000