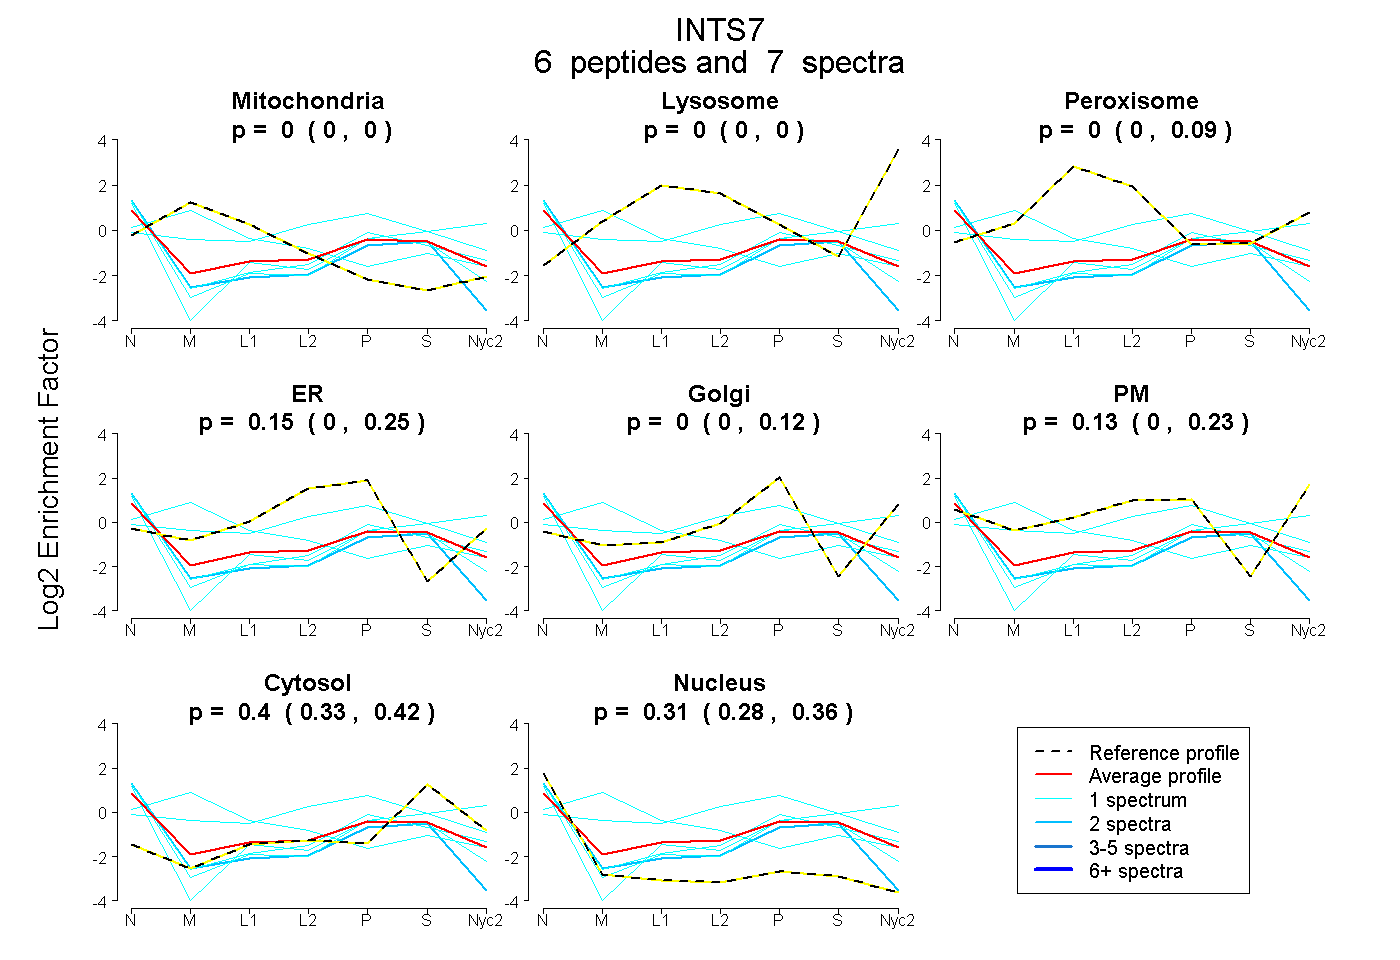
 6
6peptides
spectra
0.000 | 0.000
0.000 | 0.000
0.000 | 0.087
0.000 | 0.249
0.000 | 0.120
0.000 | 0.232
0.326 | 0.424
0.278 | 0.355
1peptide
spectrum
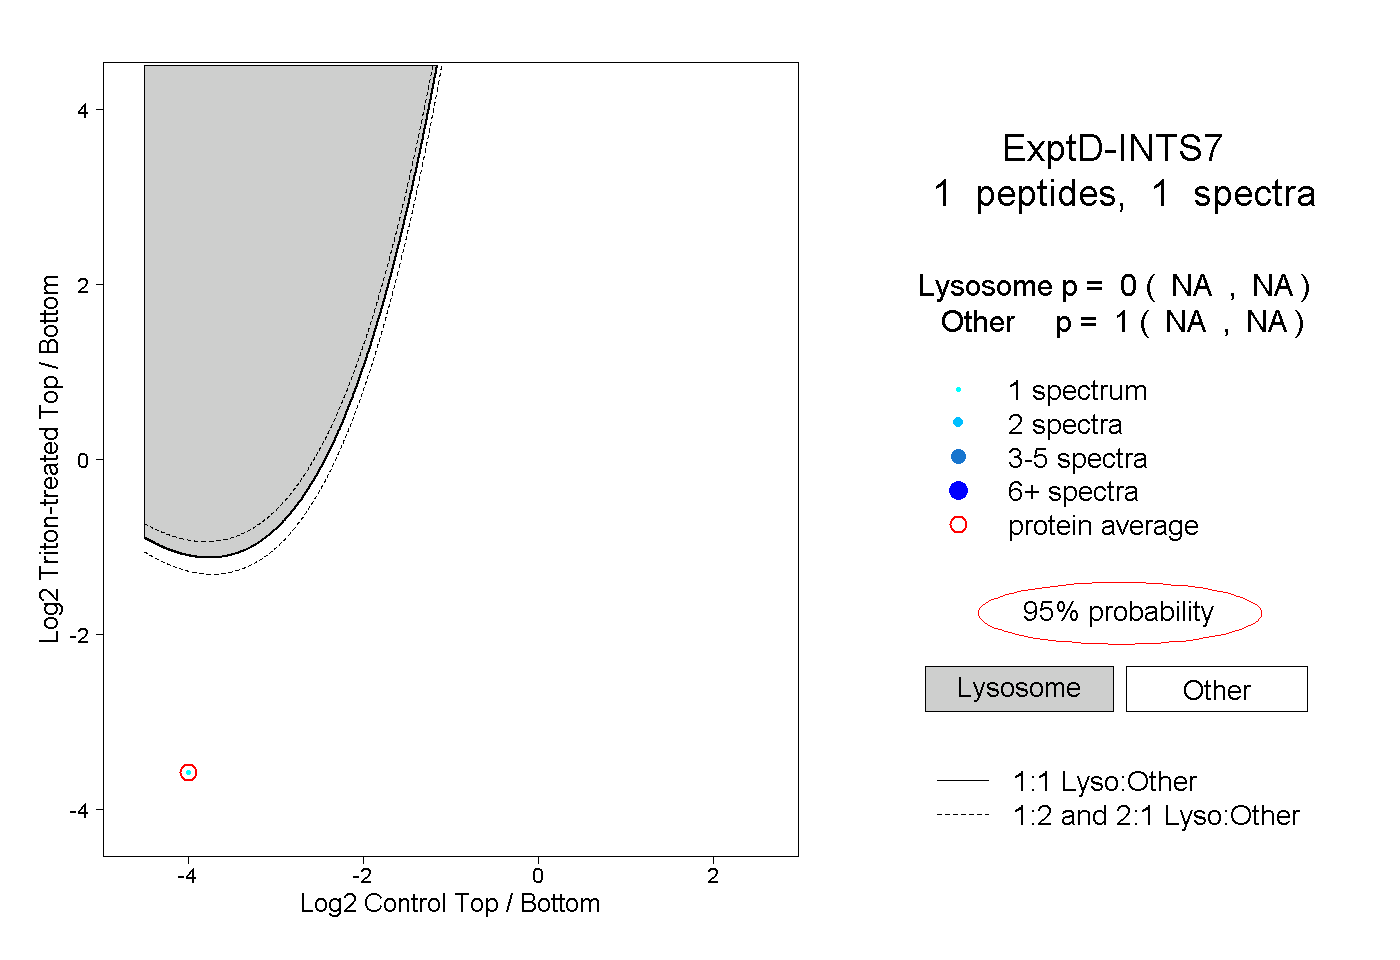
NA | NA
NA | NA
| Plot | Mito | Lyso | Perox | ER | Golgi | PM | Cytosol | Nucleus | |||||
| Expt A |
6 peptides |
7 spectra |
|
0.000 0.000 | 0.000 |
0.000 0.000 | 0.000 |
0.002 0.000 | 0.087 |
0.155 0.000 | 0.249 |
0.000 0.000 | 0.120 |
0.131 0.000 | 0.232 |
0.397 0.326 | 0.424 |
0.315 0.278 | 0.355 |
||
| Plot | Lyso | Other | |||||||||||
| Expt D |
1 peptide |
1 spectrum |
|
0.000 NA | NA |
1.000 NA | NA |